The world has evolved in such a way that it might be a challenge for many marketers to adapt and learn all the new skills and techniques that are currently being used in business marketing. With the big data explosion, the way companies send their message to customers has changed drastically.
Businesses are more data-driven than ever, and so is marketing. Therefore, it is up to us to use all the tools and techniques at our disposal to make the most out of the data that we have.
Here are 5 data science applications to level-up your business’ marketing game:
1 Sentiment Analysis
Sentiment Analysis (also known as Emotion AI) is the process of mining and analyzing text to extract contextual information from that text using Natural Language Processing (NLP). For example, you can mine text based on specific criteria from what your customers are saying on Twitter about your last campaign using hashtags and keywords, then use NLP tools that can extract sentiment information from those tweets, measuring the public’s reaction.
You can get insights that are incredibly useful for your marketing team and answer questions like how many people complaining about your last product, number of mentions of your brand by gender, region, age, etc.
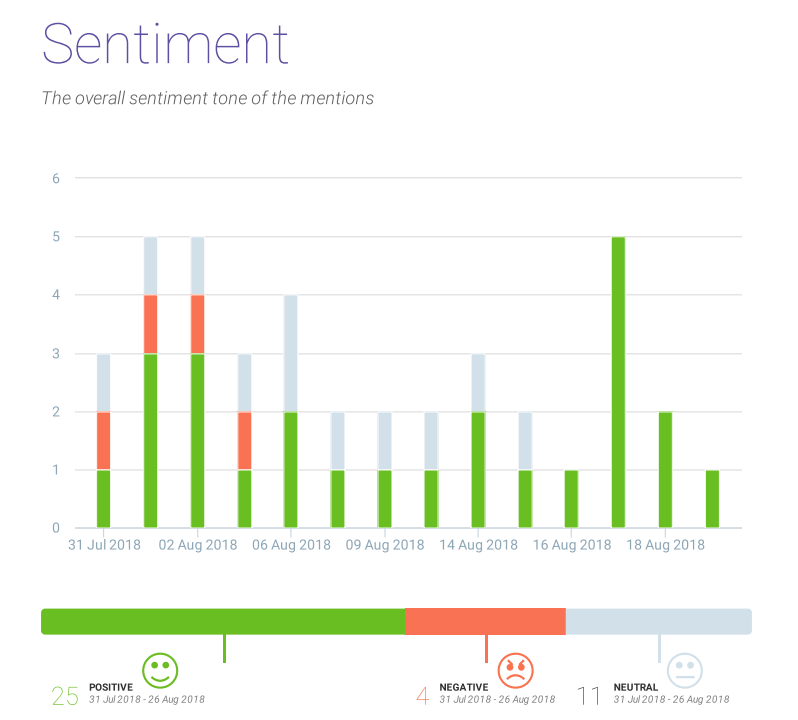
Example Sentiment Analysis dashboard. Source: Brand Mentions.
There are many social listening tools like Salesforce Social Studio or Agorapulse that use Sentiment Analysis to constantly monitor your brands’ social media channels and even manage, create, and plan your content at the same time.
This technique can be so advantageous that we even wrote a whole article dedicated to Sentiment Analysis and its most important use cases in marketing and consumer research. Check it out!
2 Customer segmentation
A one-size-fits-all approach can kill your marketing. Every person has different demographics, interests, personalities, etc. and the broader the audience, the more important it is to grouping it into segments that can allow your team to target campaigns to each of these segments.
Some customers prefer telephone calls, while others respond better to an email or text message. Looking at coincidences of particular criteria in your customer’s data like touchpoint engagement or purchase patterns, you’ll be able figure out and arrangement into types characterized by particular attributes. Then you can target specific, relevant messages at each group.
Now that companies have more data than ever, they can use statistical analysis and data science techniques to segment these groups even further into micro-segments that allow marketers to take a knife-edge approach to their campaigns.
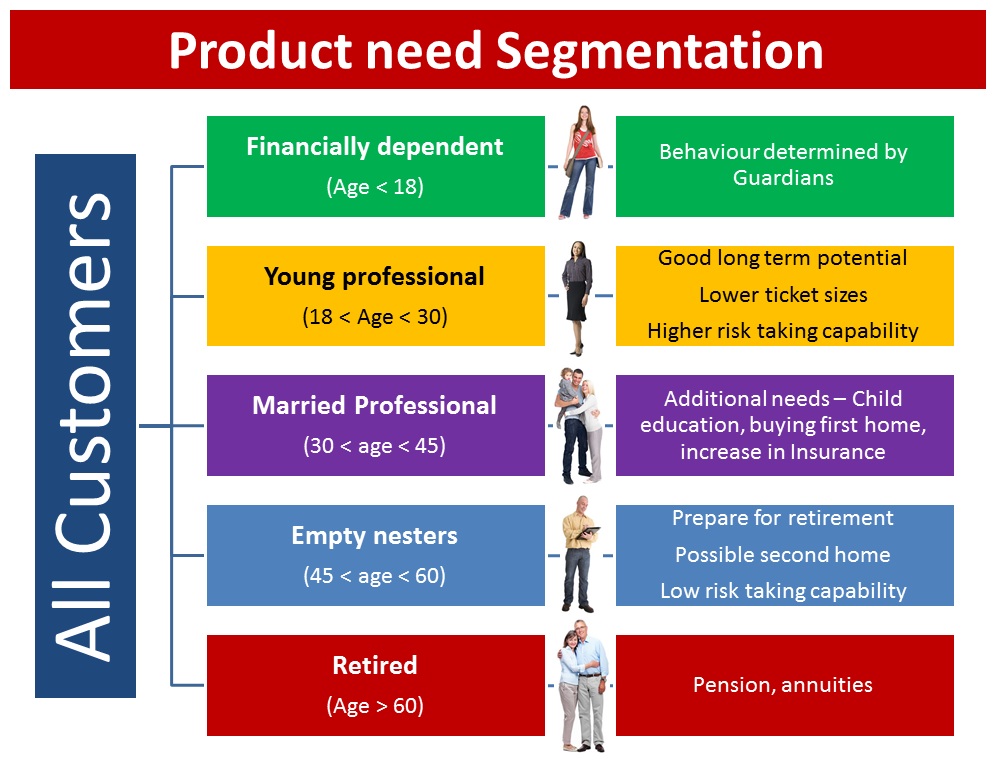
Example customer segmentation. Source: Analytics Vidhya.
In micro-segmentation, geography could be broken into regions, then states, then cities, then neighborhoods. You can make target personas so specific, that it is possible to even predict customer behavior to a point that you can know your customer’s needs before they know themselves.
A very popular example of how much power this data brings you is that time when Target predicted that a customer was going to have a baby based on her buying behavior, sending her coupons for baby items. All of this was based on a “pregnancy prediction” score they developed to target ads to their pregnant customers. It went so far that they had to tone the whole thing down because it was so accurate that people got creeped out and went all over the news.
3 A/B Testing
A/B testing (or split testing) is the process of comparing two versions of a web page, email, or any kind of marketing asset to test and compare which one performs better.
You can have, for example, two different designs for a landing page, send one design to one group and the other version to a second group. Then you can measure which page performs better in metrics such as traffic, clicks, or conversions. But remember: Data doesn’t mean anything if we don’t know what to do with it.
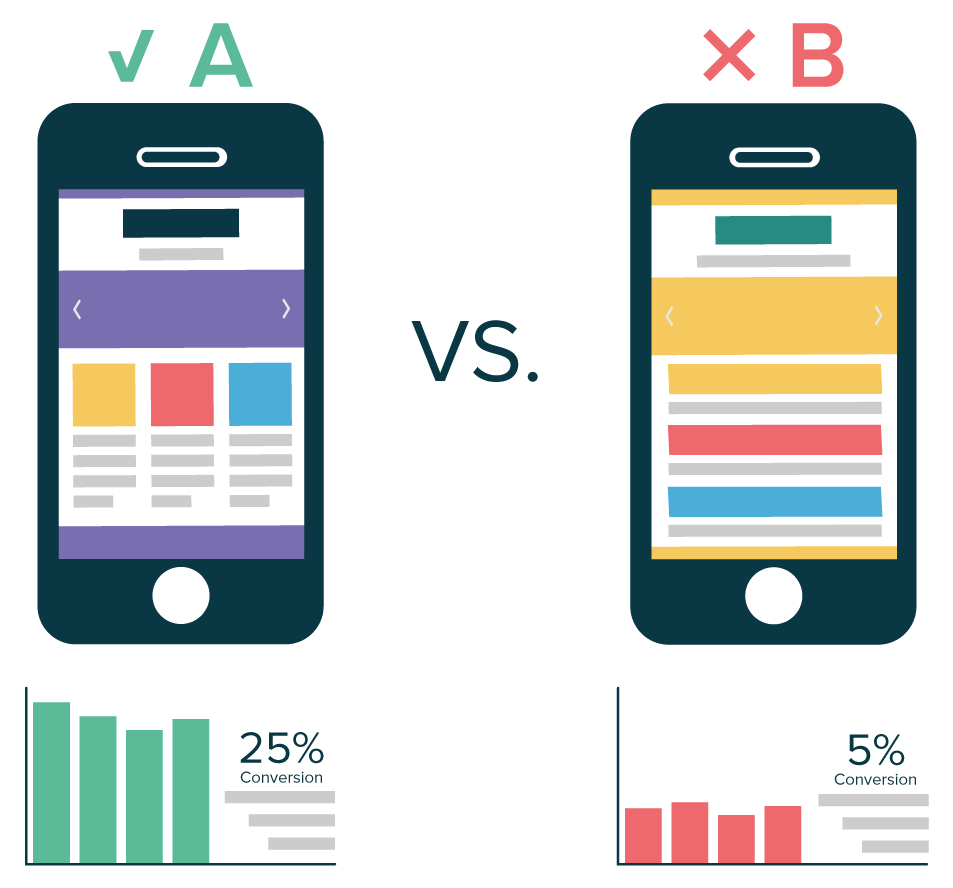
A/B Testing. Source: Strands Retail.
You need to dig into WHY one performs better than the other. Then, use this information to help you decide which one will be the final design of your landing page, and influence your decisions when creating landing pages in the future.
4 Lead Scoring
It is usually thought that the more leads come your way, the better. But this is not always the case. If you focus solely on getting more leads, your salespeople might end up finding themselves swimming through a sea of leads, less than half of which will likely ever convert to customers. So how is your sales team supposed to find and prioritize the leads that are most likely to buy?
Lead scoring is a methodology used to measure the quality of sales leads based on their attributes. Then, these leads can be given a score to be ranked in order of priority. Giving leads priority based on their score saves salespeople time and increases the efficiency of the sales process.
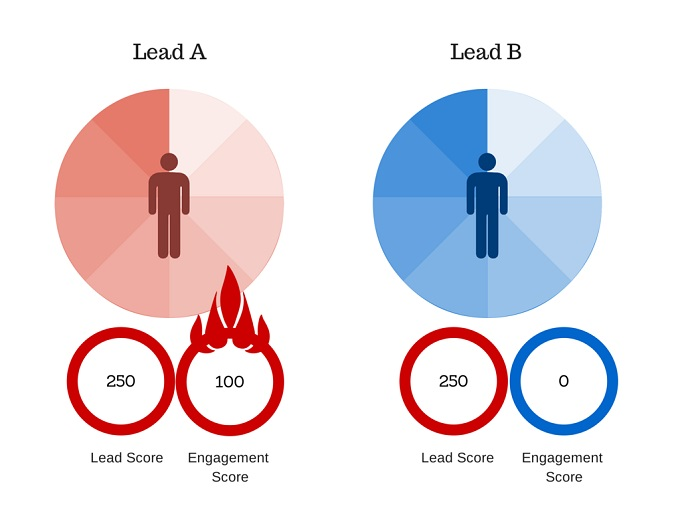
Lead Scoring example. Source: BigCommerce.
A lead scoring model can be adapted to many different types of business, and these models can be based on the type of data that you can collect from the people who engage with your business. You can use demographic information to give positive score to those who live in neighborhoods with high buying behavior or vice versa.
Check out this HubSpot guide to lead scoring to learn more.
5 Market Basket Analysis
Market basket analysis (MBA) is a technique used to better understanding customer purchasing patterns. It is based on the theory that if someone buys a certain group of items, they are more (or less) likely to buy another group of items. For example, a person that buys a printer is much more likely to buy printer ink than another customer that hasn’t bought a printer yet.
Even if that example seems obvious, there are many other examples in your business that you might not know about that you can uncover with the right set of algorithms.
In market basket analysis, association rules count the frequency of items that are bought together in order to find associations that occur more often. If, as has been observed, purchasers of baseball bats are more likely to buy MLB team t-shirts, you can target t-shirt ads or even discounts to those who buy bats.
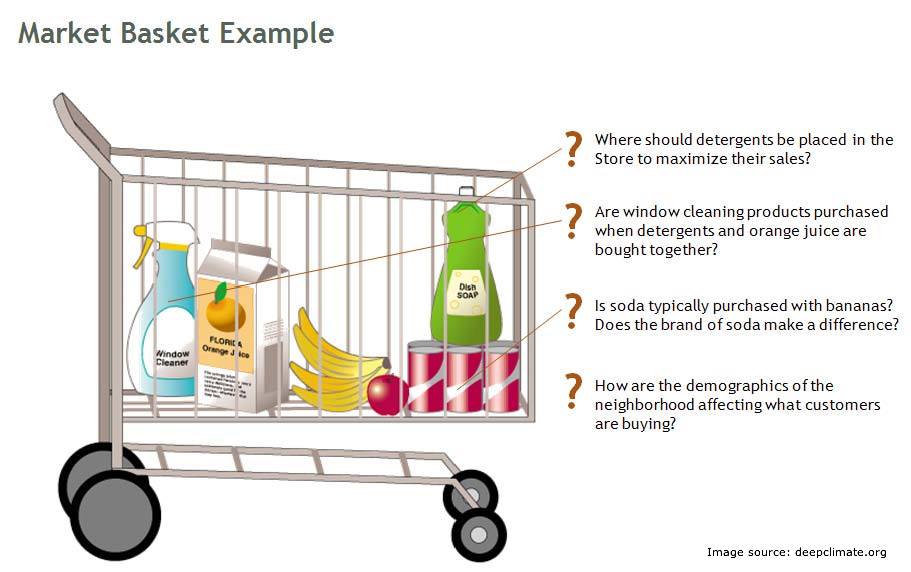
Market Basket Example. Source: Analytics Vidhya.
Keep in mind that generating reliable insights from market basket analysis often requires large volumes of transactional data, and large datasets are difficult to process and analyze if you rely solely on spreadsheets.
Data visualization and CRM as the center of your business data
Analyzing and maintaining large datasets is not an easy task. CRM (Customer Relationship Management) solutions are designed to be the center of your business data, company’s relationships and interactions with customers.
CRMs and data science go hand-in-hand since these tools allow you to analyze historical data about customers like shopping patterns and overall consumer behavior from one place. You can build insightful dashboards and visualize your data in a way that is meaningful to your business.
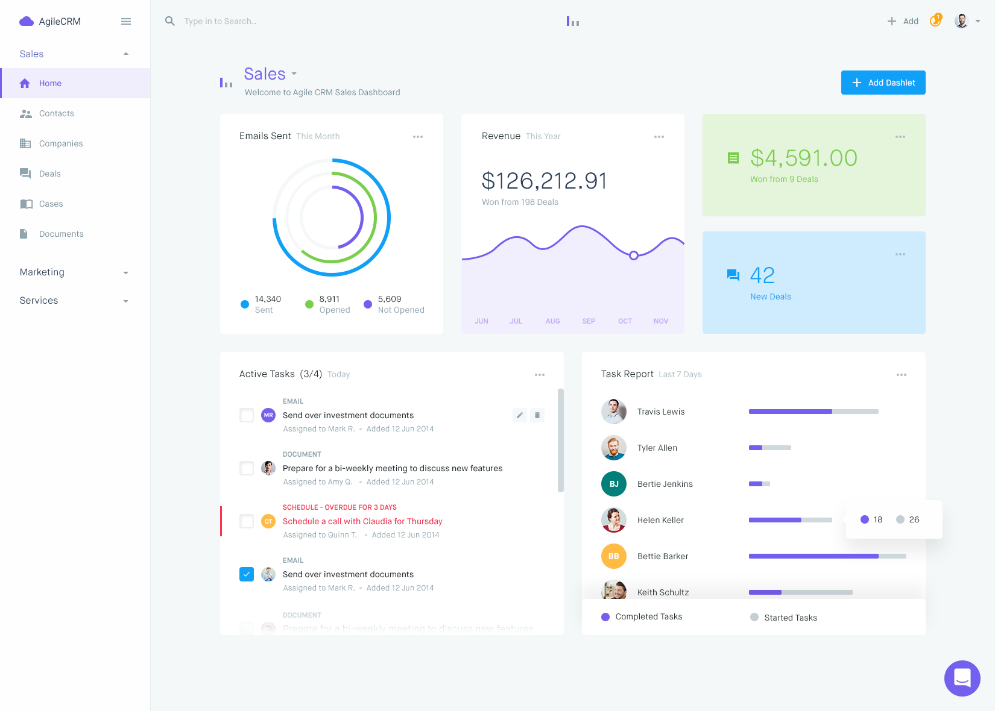
CRM Dashboard example. Source AgileCRM.
Furthermore, modern CRM tools like Salesforce can be integrated with many third-party data analytics solutions that can be used for customer segmentation, sentiment analysis, and all the techniques we mentioned above.
Today, the range of possibilities for marketers is wider than ever, and it’s up to them to use the power of data and analytics, and all the tools at their disposal.
We at Empirical help companies make the most out of their data to achieve their goals. If you’re interested, book a time with one of our specialists. We can work together to find the right solution for your business!
Click here to download the PDF version of this blog!
References
- Olenski, S. (March 6, 2018). Data Science Is The Key To Marketing ROI - Here's How To Nail It. Retrieved from https://www.forbes.com/sites/steveolenski/2018/03/06/data-science-is-the-key-to-marketing-roi-heres-how-to-nail-it/#ab014db31c3b
- Siddharrth, M. (April 23, 2019). 20 Practical Ways to Implement Data Science in Marketing. Retrieved from https://towardsdatascience.com/20-practical-ways-to-implement-data-science-in-marketing-e10da4a6d0b2
- Jain, K. (August 17, 2013). Importance of Segmentation and how to create one? Retrieved from https://www.analyticsvidhya.com/blog/2013/08/importance-segmentation-create/
- Strands Retail. A/B TESTING. Retrieved from https://retail.strands.com/products/ab-testing/
- Moser, J. Lead Scoring Is Important For Your Business: Here’s How to Create Scoring Model and Hand-Off Strategy. Retrieved from https://www.bigcommerce.com/blog/lead-scoring/#why-is-lead-scoring-vital-to-your-business
- Analytics Vidhya (August 4, 2014). Effective Cross Selling using Market Basket Analysis. Retrieved from http://www.analyticsvidhya.com/blog/2014/08/effective-cross-selling-market-basket-analysis/