On May 6, Tableau released their second feature update of the year. This update comes with big changes to Tableau’s data model that will improve the way we set relationships with our data as well as many other features we are very excited to talk about.
As we did with Tableau 2020.1 feature update, we at Empirical have made a recap of the top 10 new functionalities on Tableau 2020.2:
1. Relationships
This is without a doubt the biggest change coming with Tableau 2020.2. Tableau has changed their data model to be able to manage relationships in two different layers, allowing you to create what they call Relationships, apart from the Joins and Blends that we’re all used to. There is a lot to digest with this new feature, but it will immensely boost the performance and maintenance of your dashboards.
Up until Tableau 2020.1, relationships were managed into one single layer called the Physical Layer. This is where we used to assign relationships between datasets at a row level, make Blends (or Aggregated Joins), etc.
Since the 2020.2 update, Tableau introduced a second layer to their data model called the Logical Layer. This layer allows us to simply define the relationship between two tables and then Tableau does the hard work of figuring out how to aggregate the dataset, or how to avoid duplicates. Tableau will only query the data relevant to your analysis with the level of detail that you need.
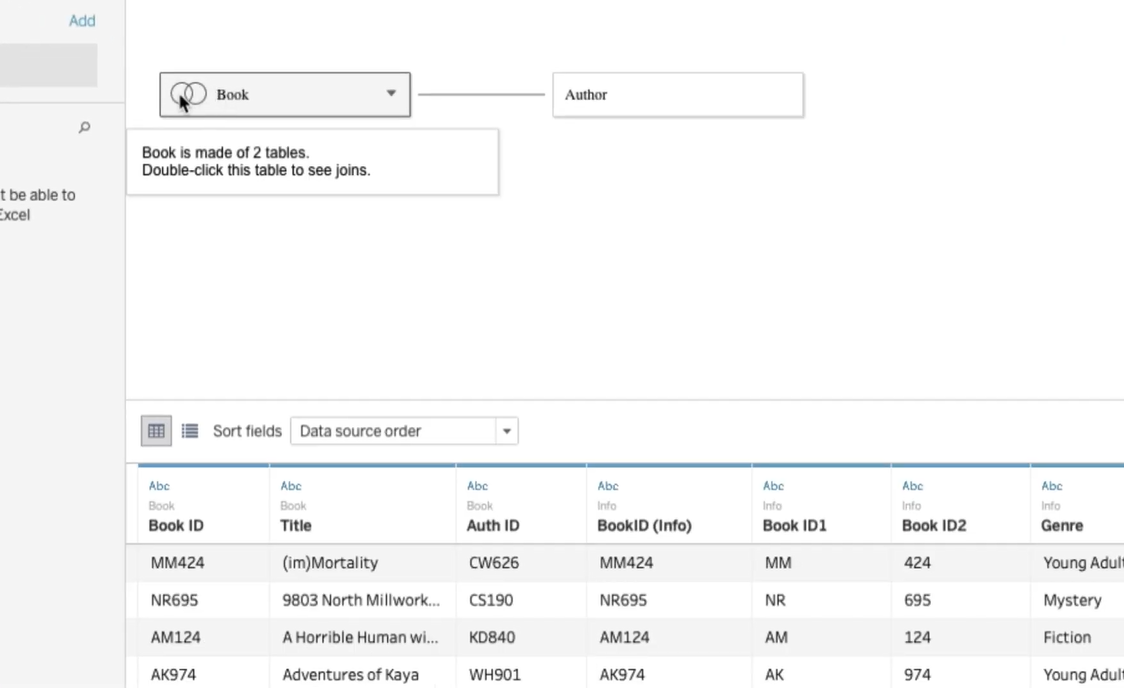
You will notice minor changes in the interface right after you drag in a table into your view, the rectangle representing your table will look a little bit different. This is because the first thing you see is the Logical Layer, which is now the default data source screen.
Now, if you want to create a Join, you will be able to access the classical interface (the Physical Layer) by clicking on the arrow next to the table you want to join to, and select Open.
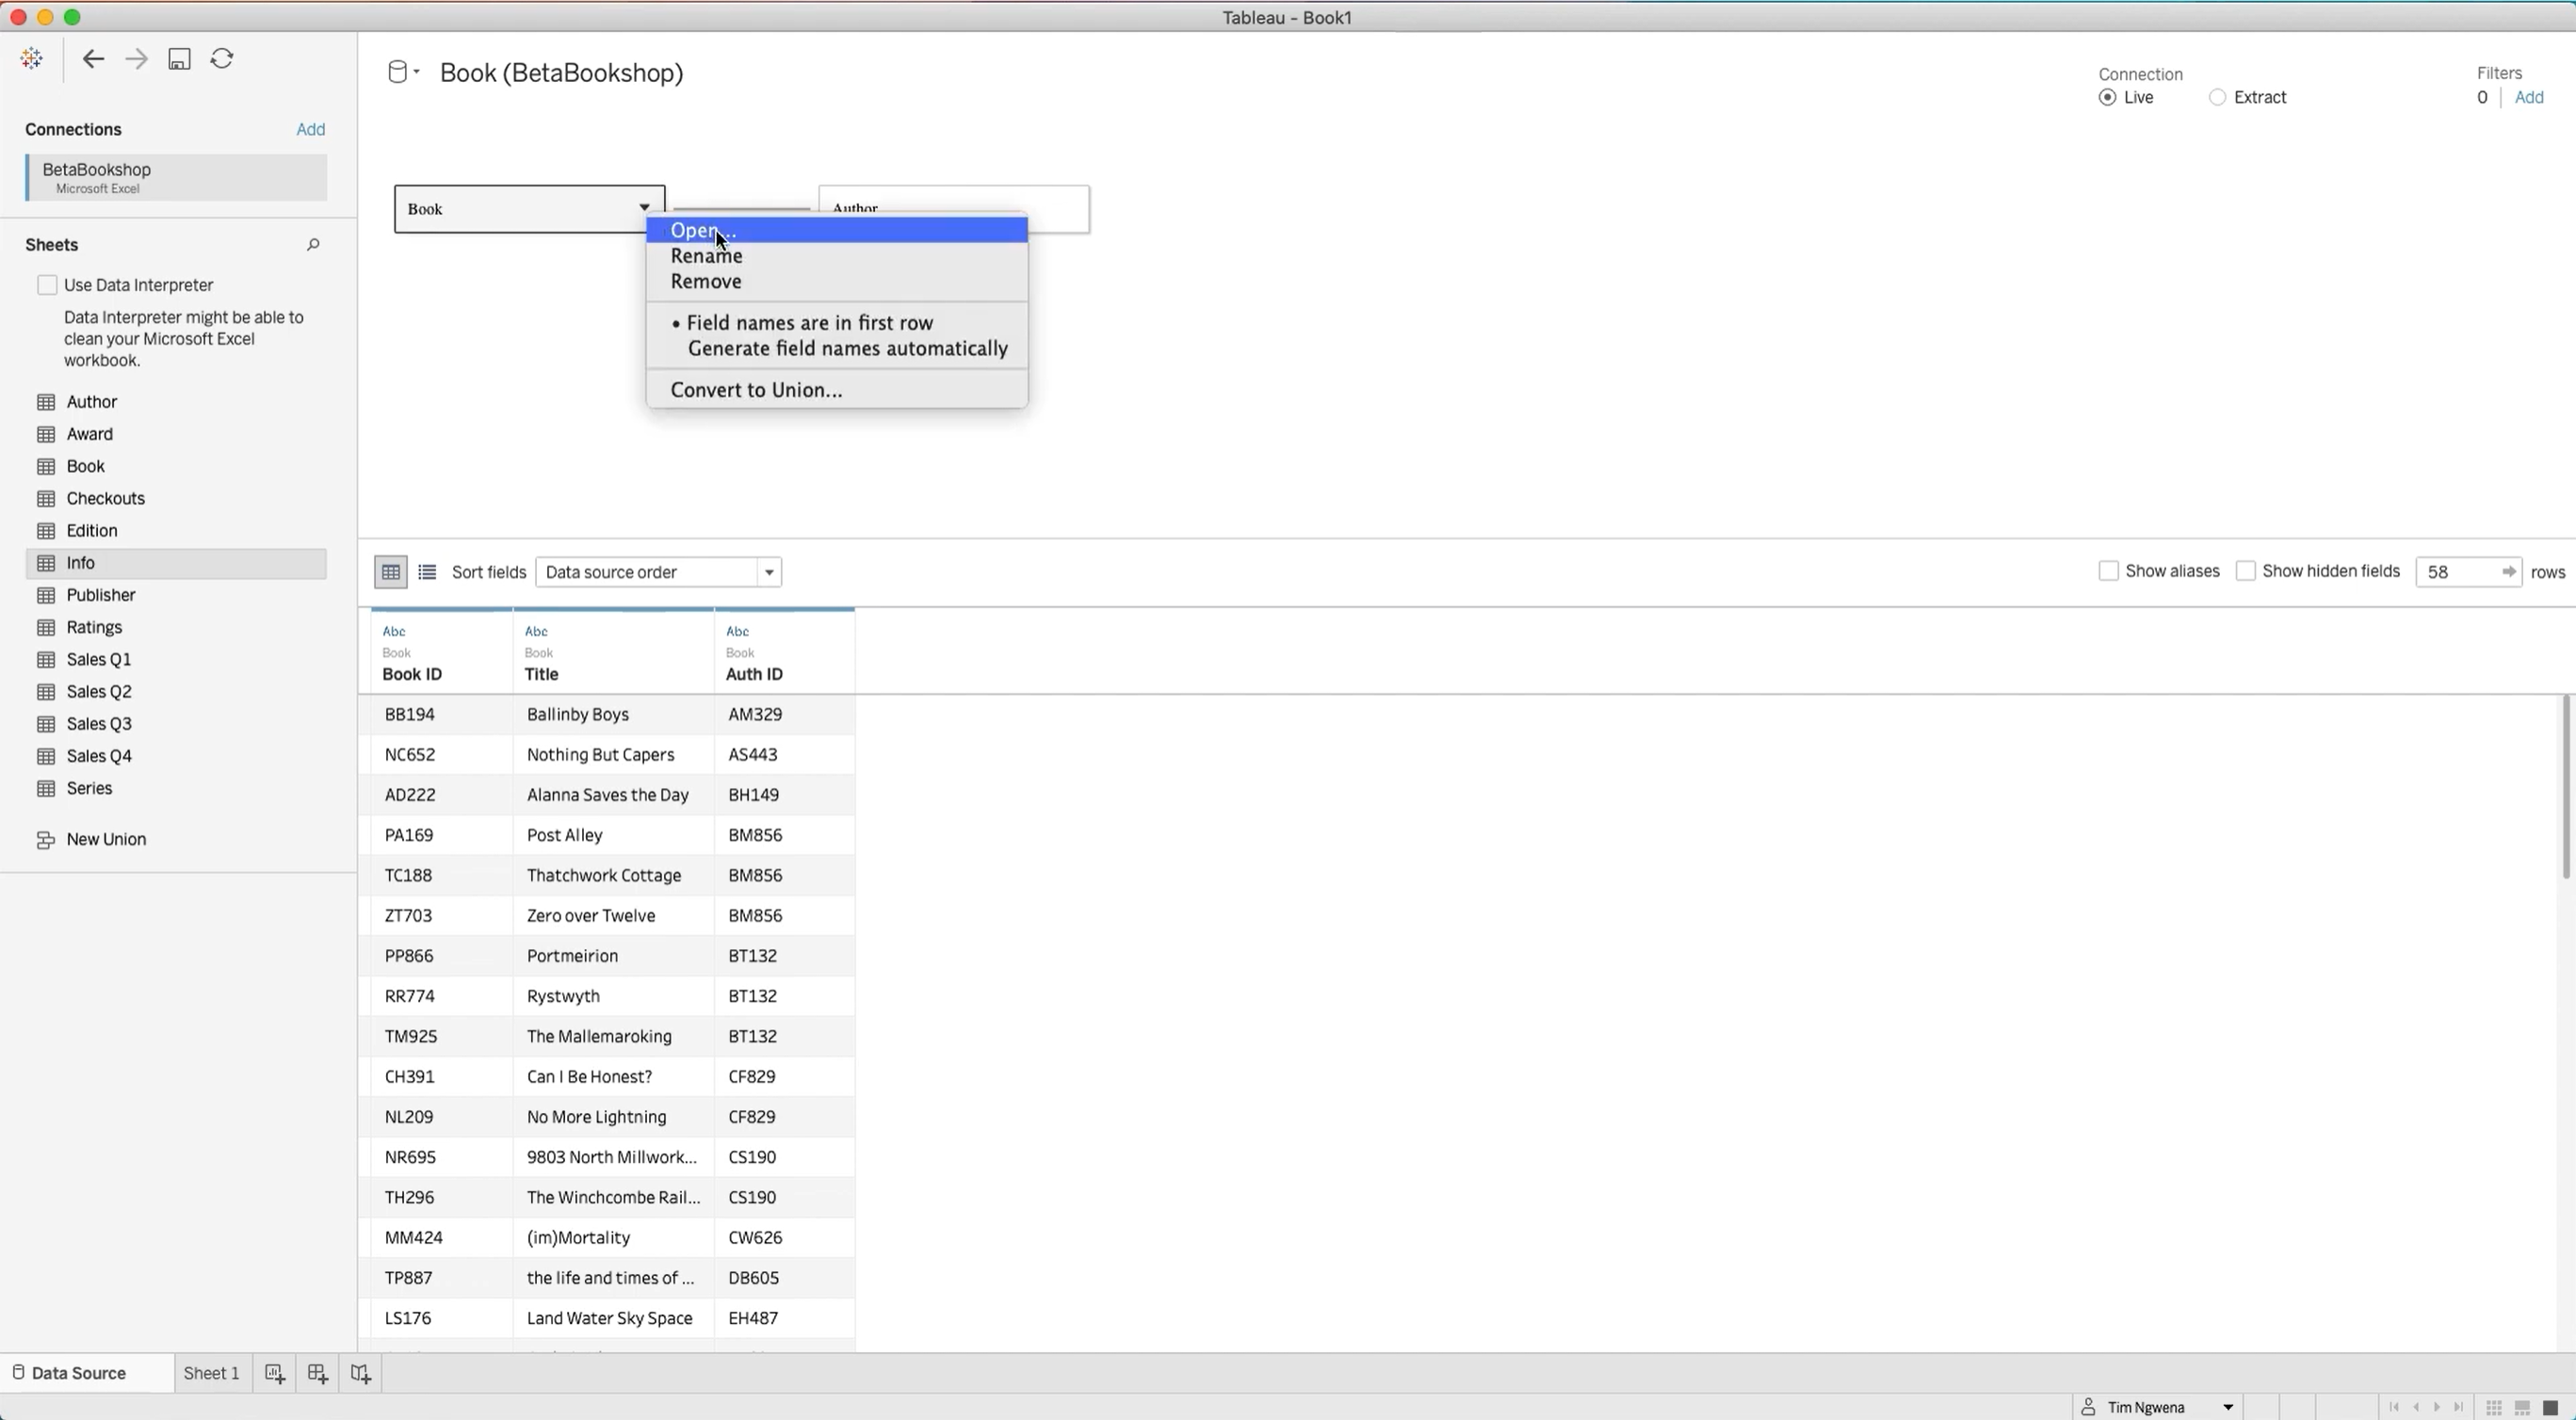
You will then see the traditional interface where you can now edit your join just like before:
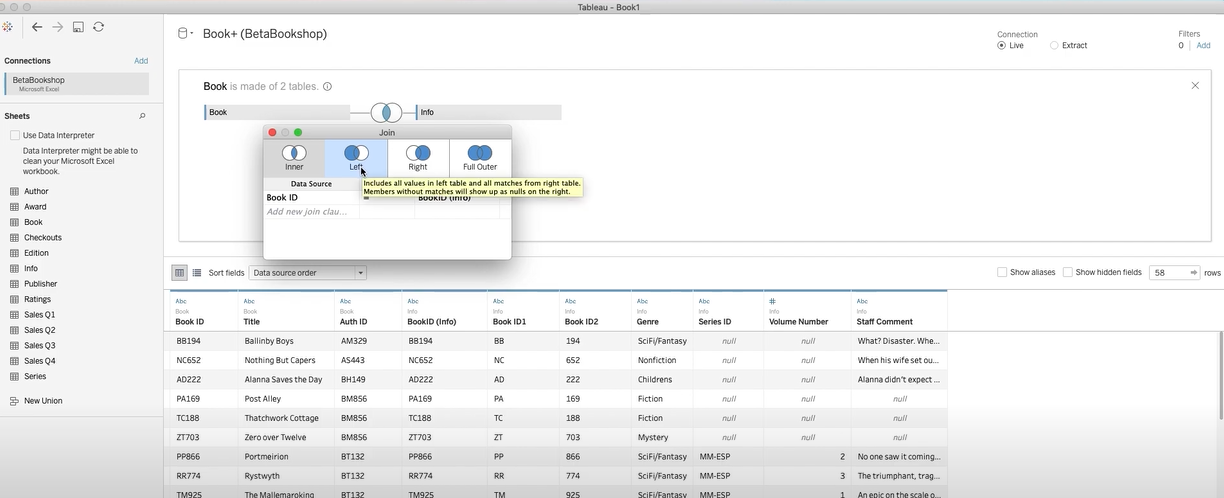
After you finish, you can click the X on the top right side to exit the Physical Layer. You can come back and exit as you please.
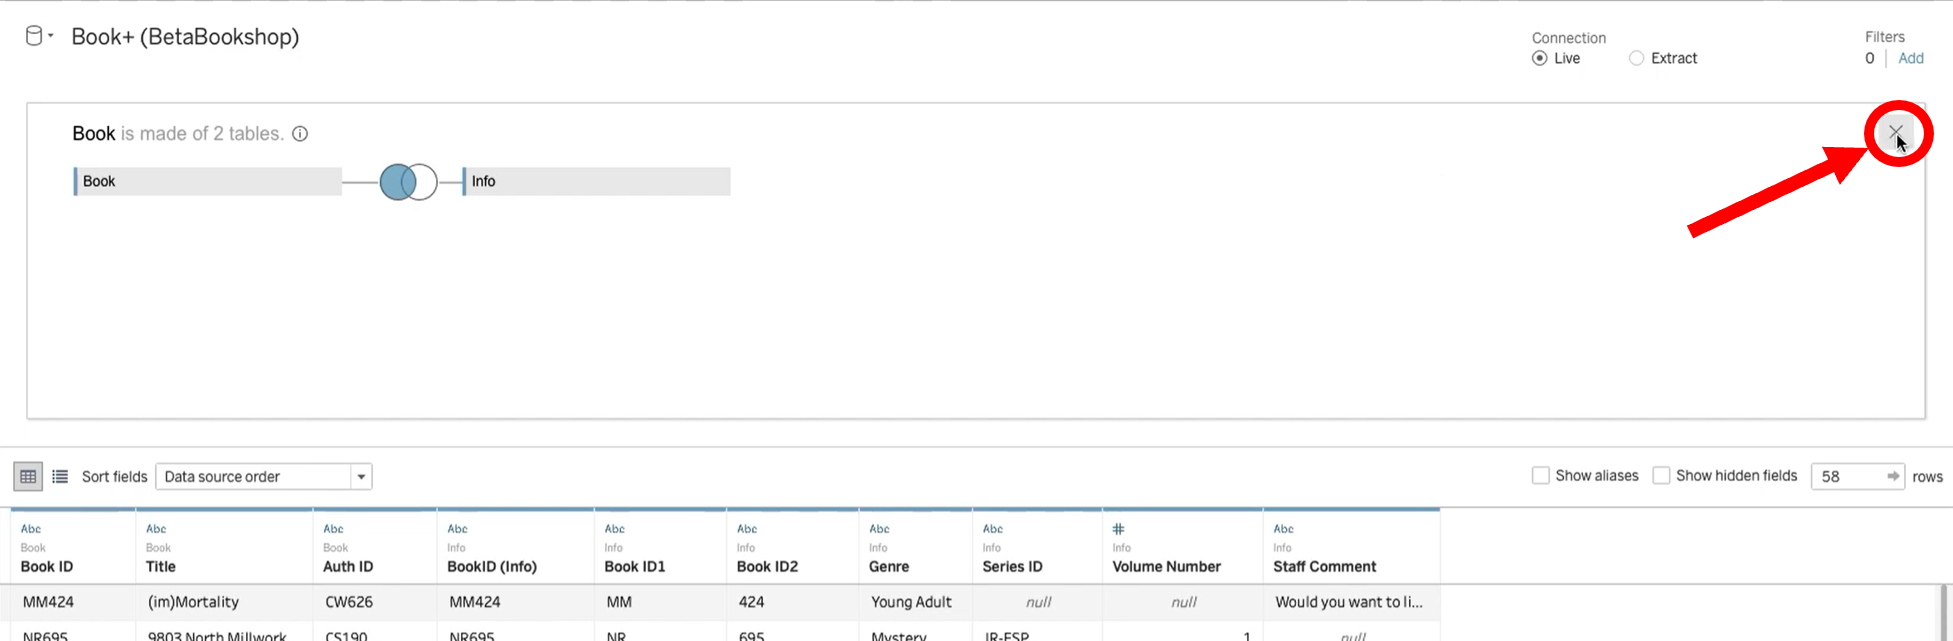
You will now see an icon on your table indicating the join you have just created:
As you can see, you won’t lose access to your Joins and Blends, and any cool dashboard you have already built will just be migrated to the Physical Layer of the data sources automatically, and they will now be shown as “Migrated Data”.
I’d recommend you to watch this video by Bethany Lyons about the capabilities of the new data model for a more in-depth explanation about this new feature.
Now, thanks to this new addition to Tableau, you won’t need to have specific questions in mind for your analysis when designing a new database since you can set it up as broadly as possible, fitting more users’ needs.
Setting up the data source using the new data model. Image source: Interworks
With this new addition to Tableau’s capabilities, it important to distinguish the different use cases for the new Relationships and the old Joins and Blends:
1.1. Relationships vs. Joins
Before Tableau 2020.2, if you wanted to see the relationship between Orders and Sales Targets based on a Sub-Category of products, you would have to merge the data, create the desired Joins and make level of detail (LOD) calcs to control the right aggregation level. The problem with LODs is that they can negatively impact the performance of your dashboard.
With Relationships, the right level of aggregation is controlled by Tableau, meaning Joins will only be executed where necessary, boosting the performance of your dashboard.
Although, this doesn’t mean that Joins have completely lost their use. If the type of merging of your tables is based on a calculation, or if you want to specify the type of Join as inner, outer, etc. Then you need to make a Join.
1.2. Relationships vs. Blends
The intended function of Blends is to bring together data from different levels of aggregation. So, if we go back to our previous example, it is perfectly reasonable to use Blends to deal with this situation. However, using Blends comes with a number of disadvantages: You cannot publish them as a data source since they are defined on a worksheet, they are computed as part of a query which negatively affects performance on large datasets, the secondary data source is always aggregated, only left Joins are available.
Using Relationships will save you from all those problems. However, there are still cases where using Blends is your only option. Like when you are not in control of the data sources and one of the tables you want to use has been published by someone else.
Also, one advantage of using Blends is that your tables relate to different fields for each worksheet. So, instead of having many data sources with the same logical tables but different relating fields, you would connect to you tables once, then activate the connection you need on a specific worksheet.
2. Metrics
Now you can monitor KPIs with Metrics. You can create a Metric from almost any Tableau dashboard to track business data at a glance, optimized for Tableau’s mobile app, and complete integration with Tableau’s platform, updating the data automatically.
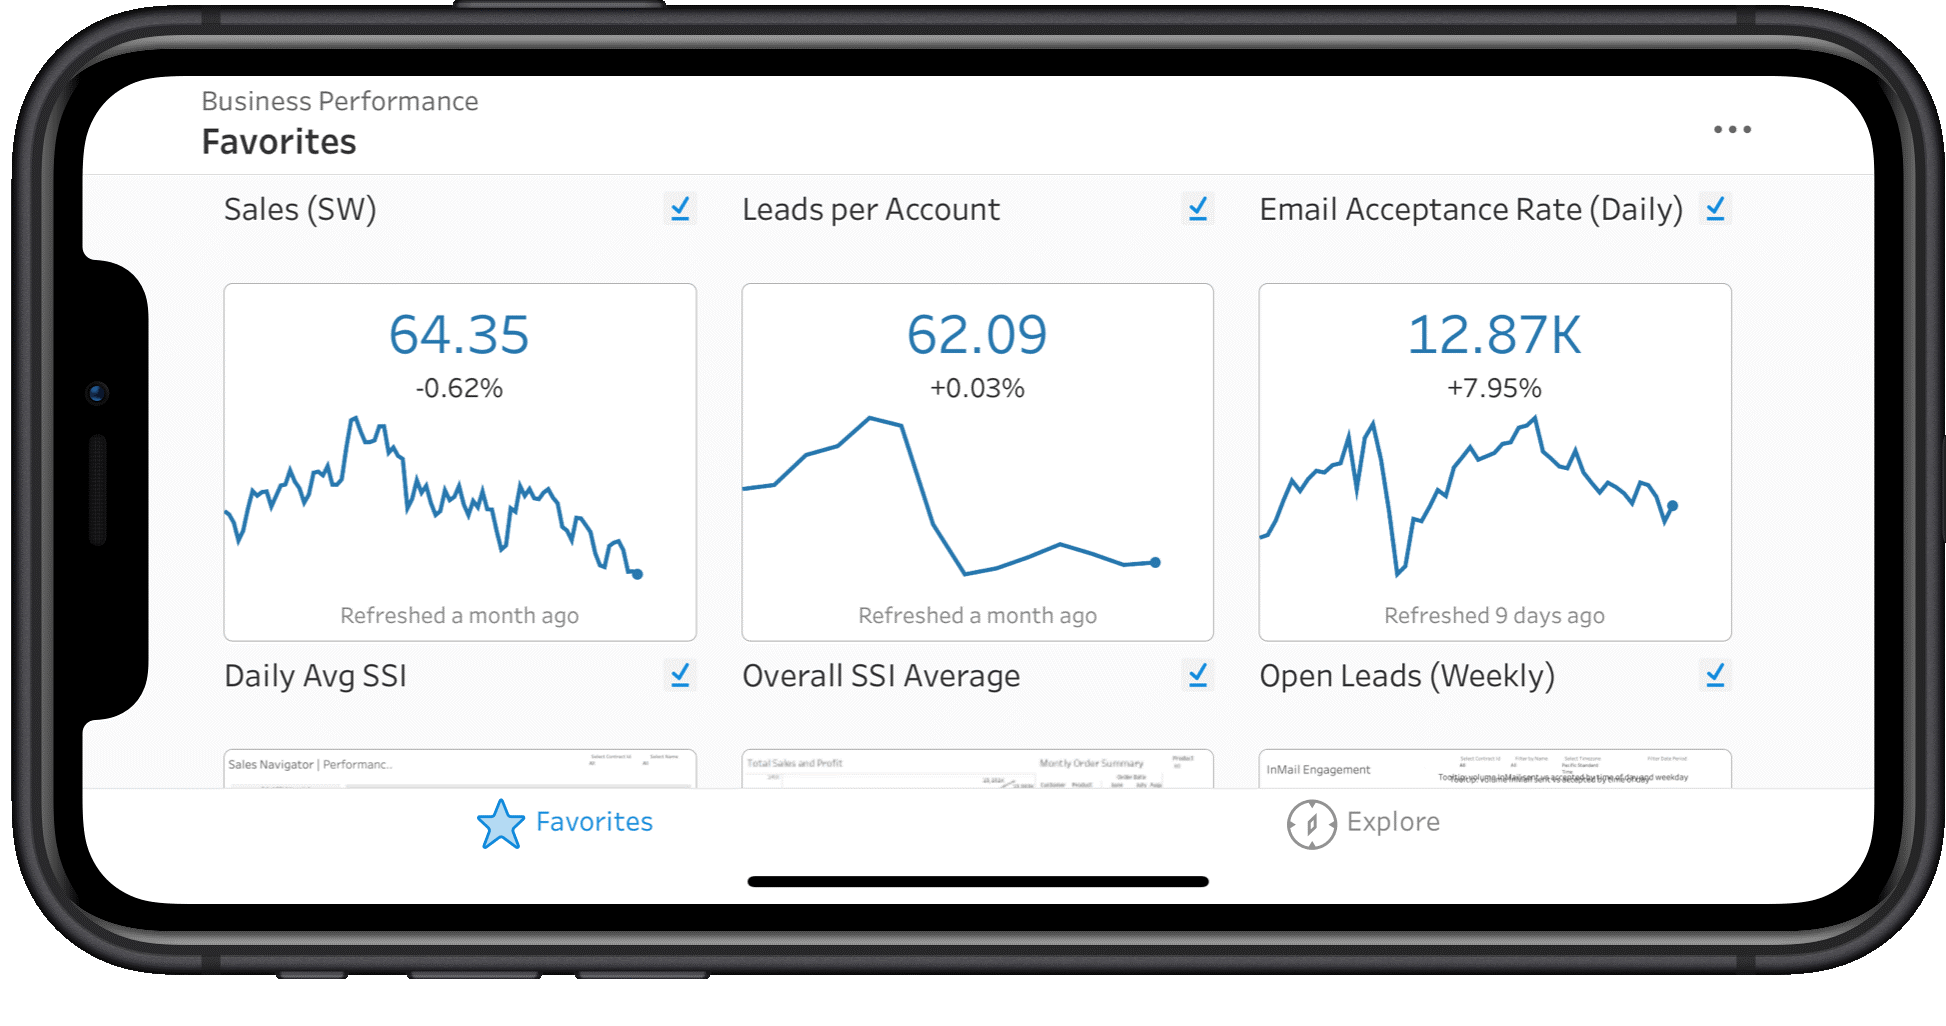
If you have multiple dashboards, you can create Metrics with key numbers from that dashboard you frequently check and add them to your favorites.
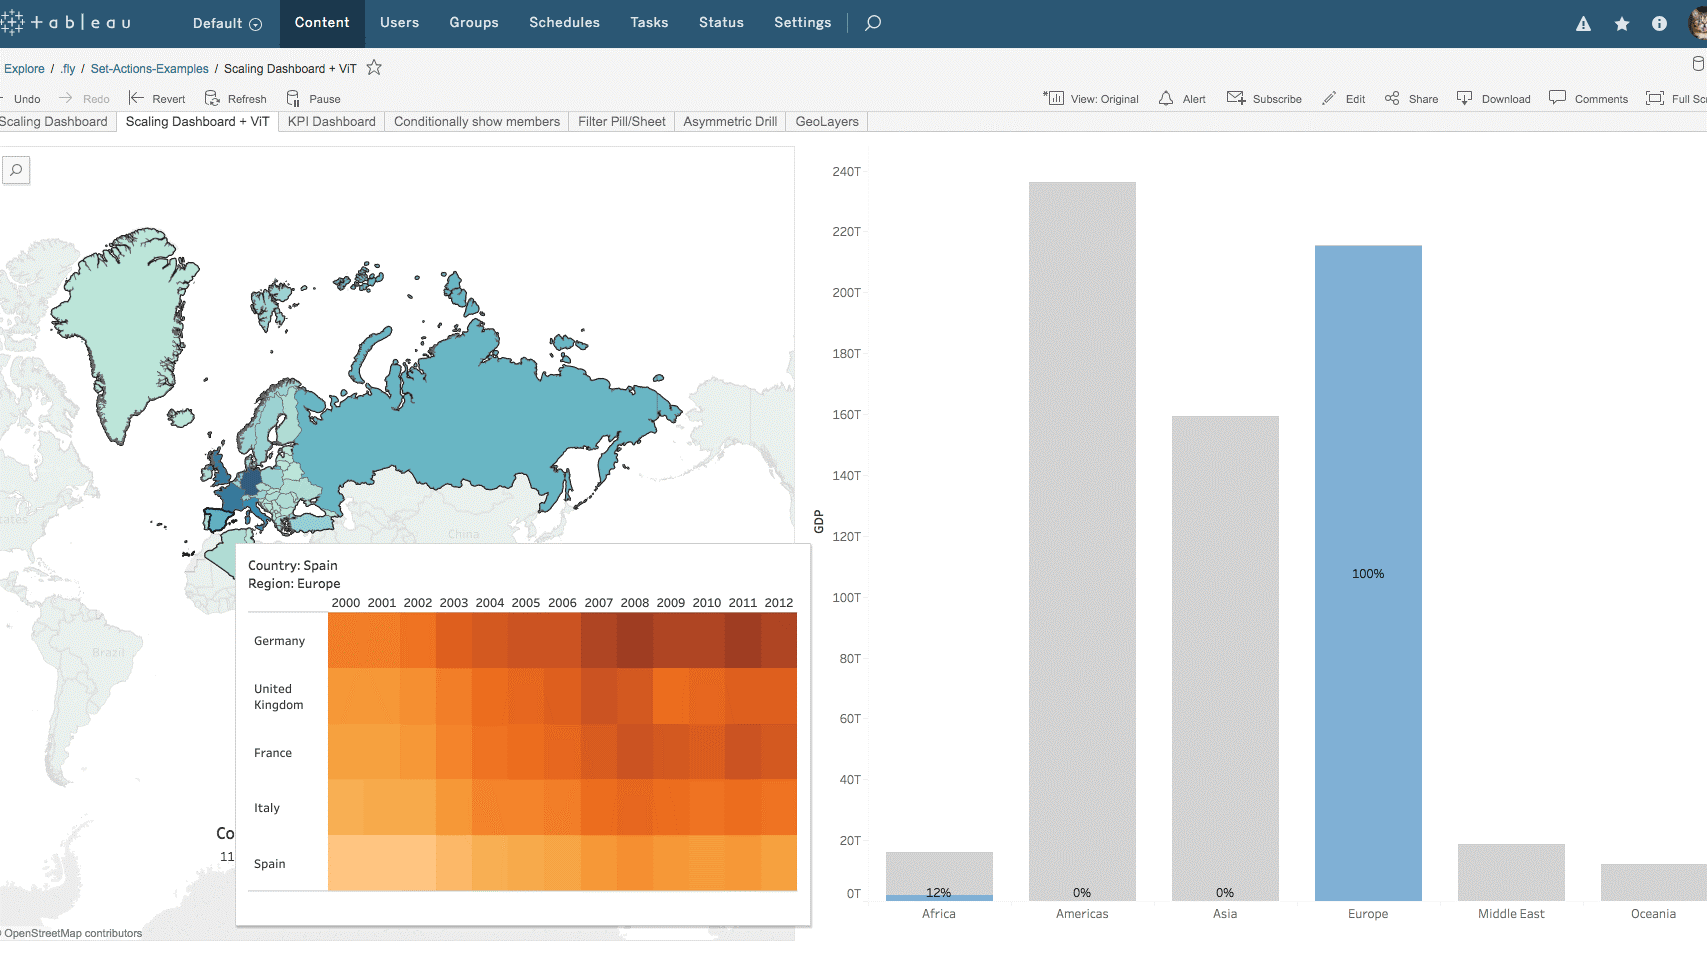
3. Set Control
You can now dynamically change the members of a set. It works as a complement of the Set Action feature introduced in Tableau 2019.1. With Set Control you can let your users select set members through direct interaction with the viz.
4. Set Actions Improvements
Now there are two new selection modes for Set Actions. Now you can incrementally add and remove values from a set. You can interact with marks in the view even after a selection is cleared.
5. Explain Data Improvements
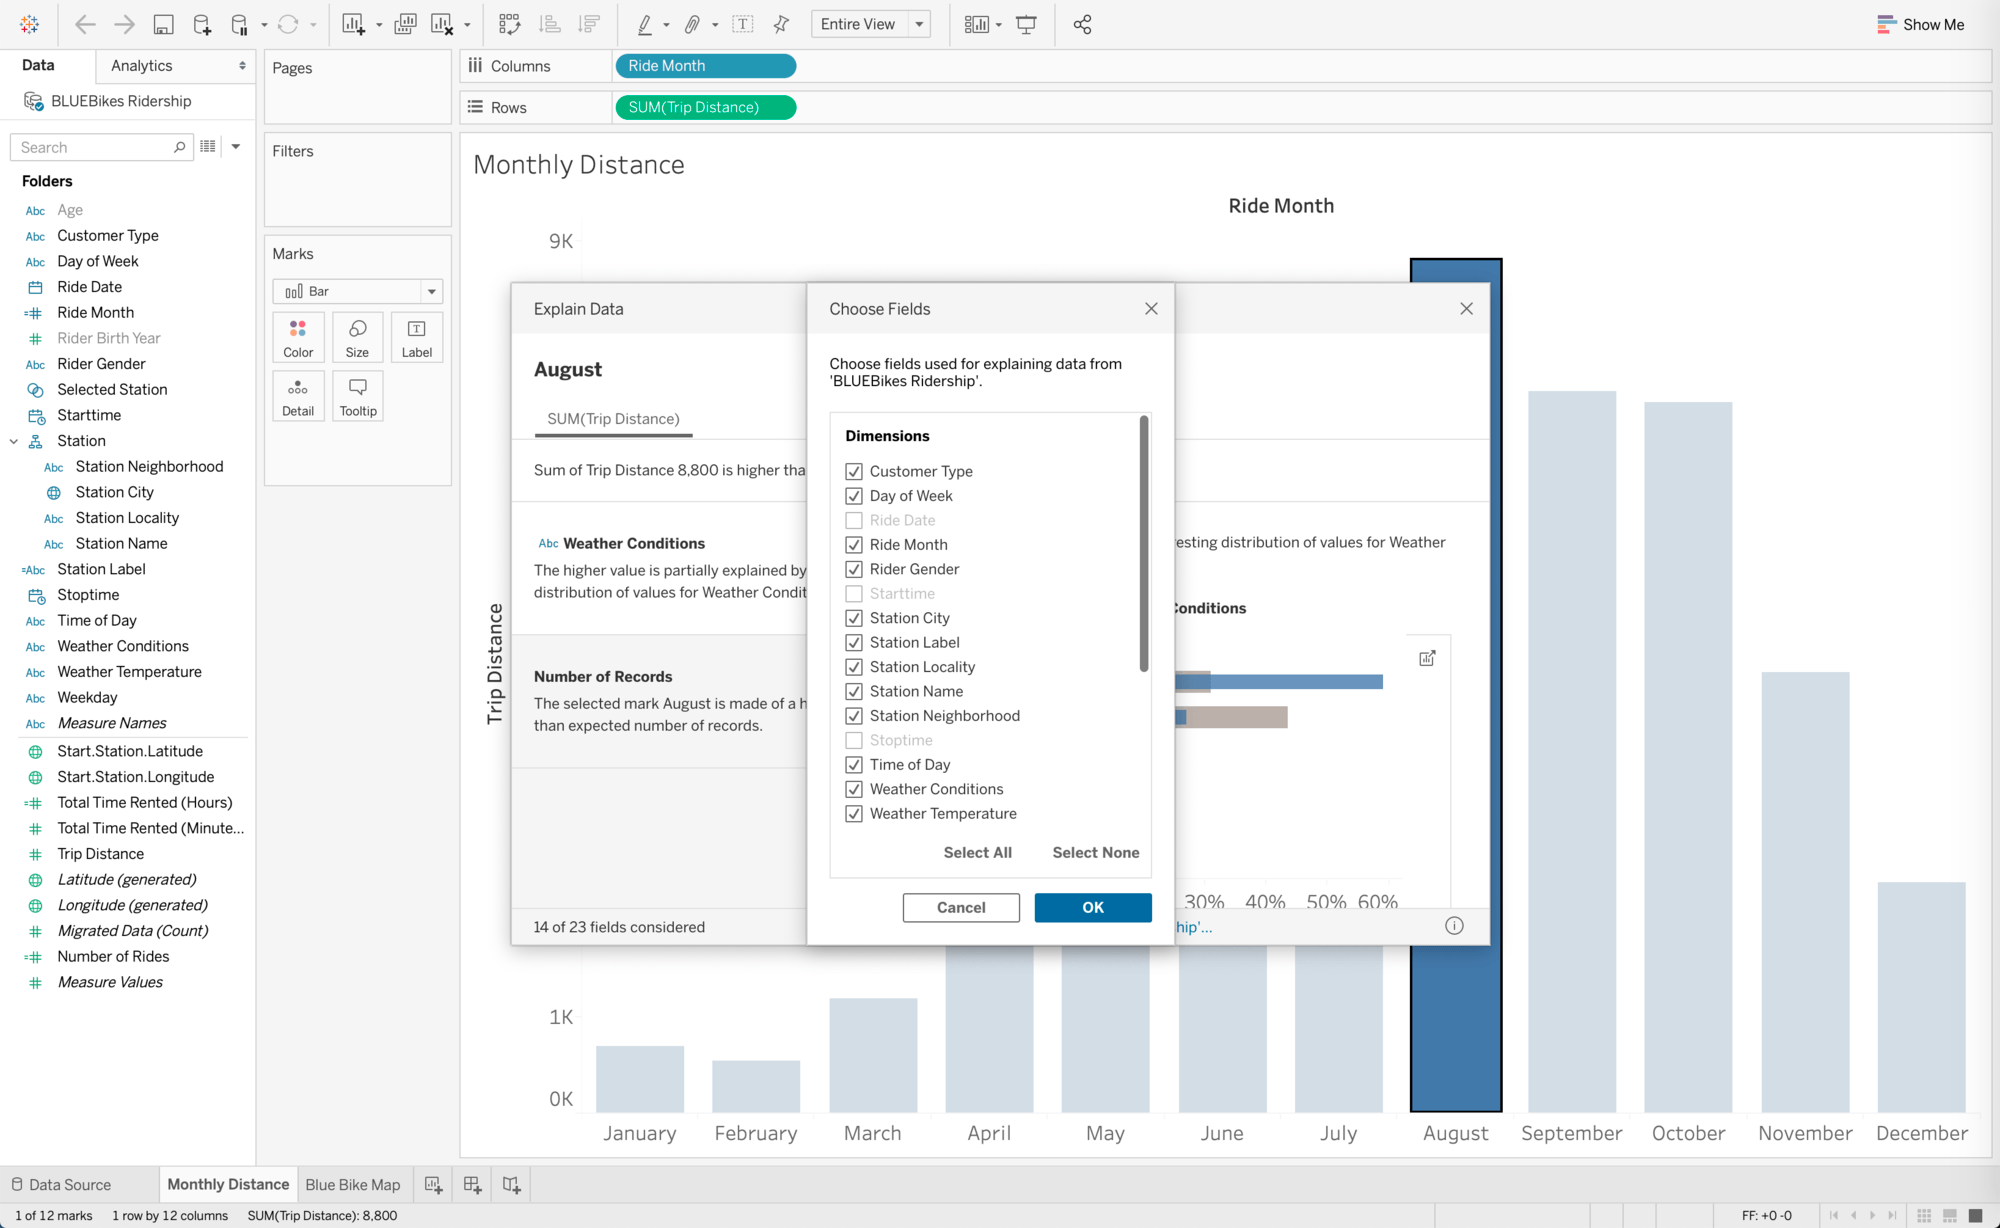
More flexibility for dashboards authors. Dashboard authors can now control which columns are modeled in Explain Data.
6. Ask Data Improvements
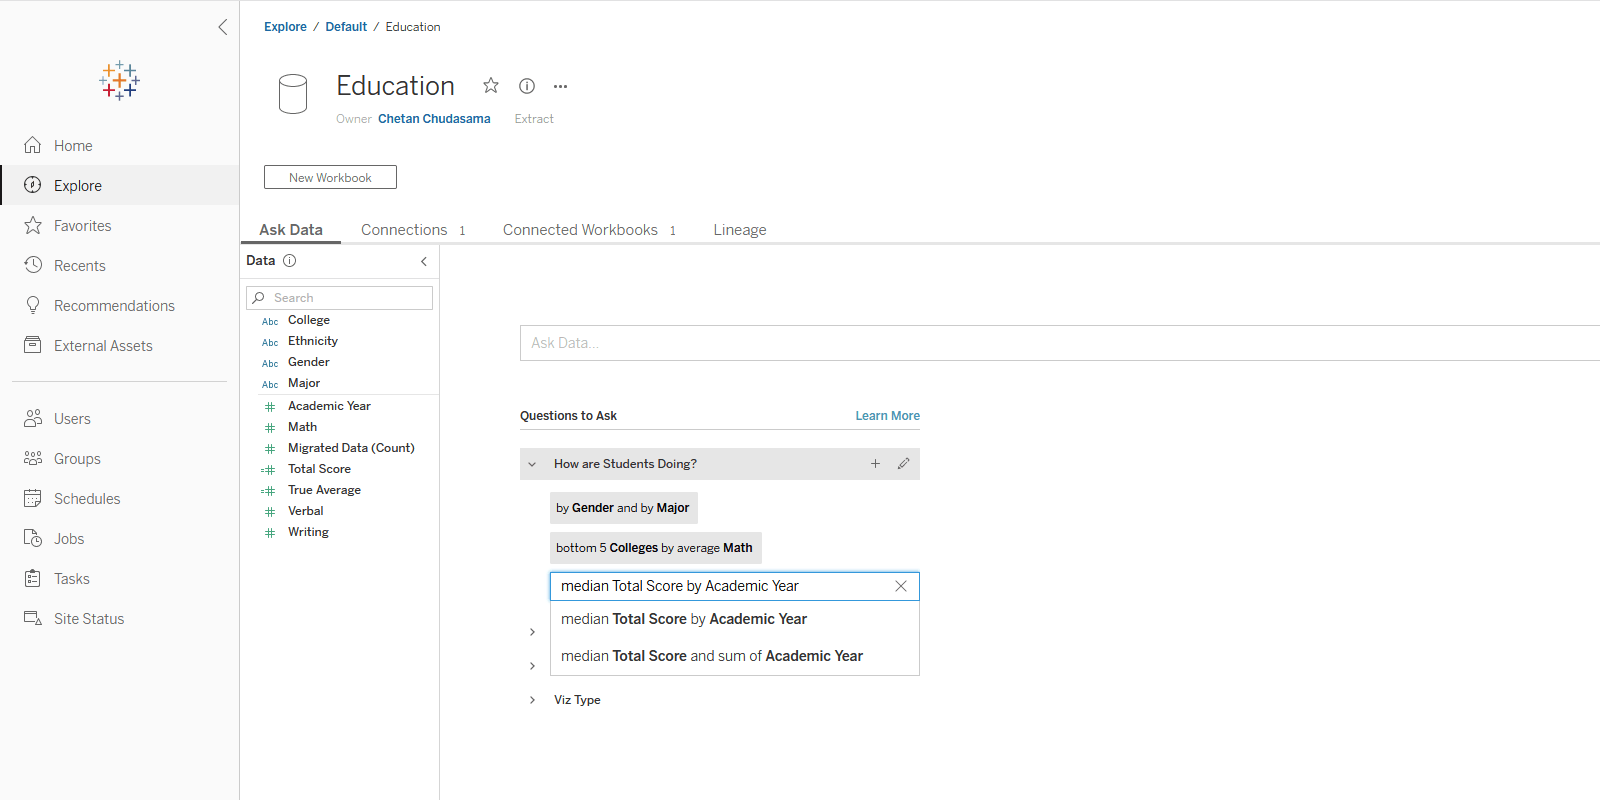
With Data Roles you can easily add important context to field definitions and synonyms and apply information across data sources. Also, data owners can now provide prompts that give users insight into the data and the types of questions they can ask.
The new data model now supports Ask Data, and this allows you to ask questions about different logical tables within Ask Data.
7. Multiple External Services Connections for Tableau Server
Server administrators can now configure multiple Analytics Extension connections in Tableau Server. Administrators can now turn connections on or off at the Site level by setting one per site through the Settings UI.
Now teams using different R, Python, and other external data science environments can share their work across the same server. Also, Settings are now easier to configure with UI controls or via the Server REST API.
8. Tableau Server Management Improvements
Tableau Server now automatically performs a set of checks as you start the initialization/upgrade process to detect common errors and issues that can arise during upgrade and install. You can also perform this check at any time with the TSM command. It is important to note that this capability is for Windows, and Tableau is working to bring it to Linux soon.
Speaking of TSM commands, many common commands can be implemented without having to restart Tableau Server. Hot config commands are identified in the command line when you are making changes.
9. Filter External Assets
You can now filter by connections type, certifications, or Data Quality Warnings from the External Assets page to get a better understanding of all the assets on your server.
10. Salesforce Connector for Tableau Prep Builder
Connect to Salesforce directly within Tableau Prep Builder and start getting to analysis faster.
Did we miss any features you think are worth mentioning? Let us know in the comments below!
Click here to download the PDF version of this blog.
References
- (2020). Tableau 2020.2. Retrieved from https://www.tableau.com/products/new-features#feature-128748
- Sandberg, M. (March 11, 2020). Tableau 2020.2 BETA Released Today. Retrieved from https://datavizblog.com/2020/03/11/tableau-2020-2-beta-released-today/
- Niemzok, S. (April 21, 2020). Comparing Tableau’s New Relationships to Blends and Joins. Retrieved from https://interworks.com/blog/2020/04/21/comparing-tableaus-new-relationships-blends-joins
- Lyons, B. (2020). Data Model Enhancements. Retrieved from https://tc19.tableau.com/learn/sessions/data-model-enhancements?_ga=2.68850129.1799847257.1586717058-2049064376.1585127038&_fsi=In9i0aCP
- Ngwena, T. (Ma 6, 2020). Tableau 2020.2: The new data model and relationships. Retrieved from https://www.youtube.com/watch?v=75zvHrnuPr0