The final Tableau release of the year is here!
Tableau 2020.1 started the year with dynamic parameters. Then, Tableau 2020.2 introduced us to the new layers of their data model. Finally, Tableau 2020.3 came with a lot of new features for Tableau Prep Builder.
The star of the show in this latest 2020.4 update is the addition of multivariate map layers, but there’s much more that has been brought into the table. So, following our tradition, here’s our feature-breakdown with everything new with Tableau 2020.4:
1 Multiple geographic data layers
Up to Tableau 2020.3, geographic data was limited by 2 layers of data through a dual axis map. Now you can add as many layers as you want by dragging your geographic data to the view and drop it on the Add Map Layer control that appears in the view. These layers can be independently customized for more flexibility in your map creation.
2 Refreshable parameter ranges for dynamic parameters
Create dynamic parameters for “range” parameters. Min and max values will be updated automatically every time the workbook is opened. Tableau will query all values in a field’s range and users can pick any value within the range, even if that value is not in the field’s discrete set of values.
3 More models for predictive modeling functions
Now in 2020.4, you’ll be able to leverage two new models for calculation function: Gaussian process regression and regularized linear regression. With more models supported, you have greater flexibility and can choose the model that best fits your use case.
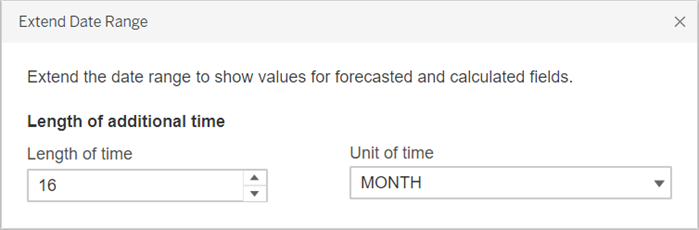
4 Date ranges can be extended into the future
Until 2020.3, we could show missing values to indicate incomplete data in the underlying data source, but only applied to dates within the boundaries of the existing data source.
In 2020.4, you’ll find a new menu option that lets you generate and display marks beyond the existing date range. Open the context menu of a continuous (green) date pill, and select Extend Date Range.
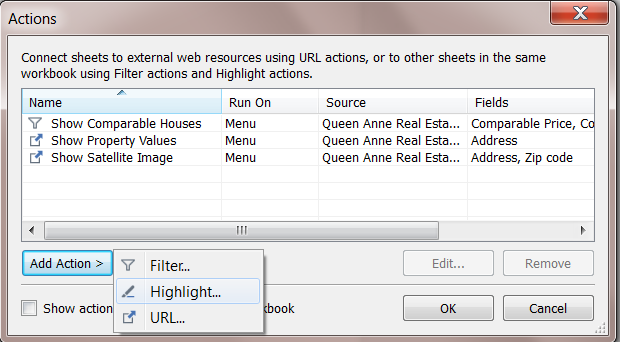
5 Highlight actions in Tableau Online and Tableau Server
Now you can create advanced highlight actions while authoring in Tableau Online and Tableau Server, from both dashboards and individual sheets.
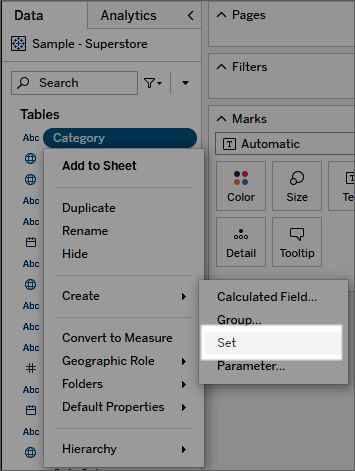
6 Fixed sets in Tableau Online or Tableau Server
Since 2020.3, we were able to create dynamic sets on the web. Now in 2020.4, you can create fixed sets in Tableau Online and Tableau Server, too. To do this, simply open the dimension’s context menu and select Create > Set.
7 Worksheet filters from Tableau Online or Tableau Server
Until now, when authoring on the web, applying a single filter to multiple sheets has been cumbersome. As of 2020.4, Tableau Online and Tableau Server customers can now apply a filter to selected worksheets by using a brand-new dialog. Simply go to a filter’s context menu and select Apply to Worksheets > Selected Worksheets.
8 Label your marks in Tableau Online or Tableau Server
You can now choose which marks to label in a visualization while authoring in Tableau Online or Tableau Server. This means you can label all marks, only the minimum and maximum values, just the line ends, the most recent values, or only the selected or highlighted marks in the view.
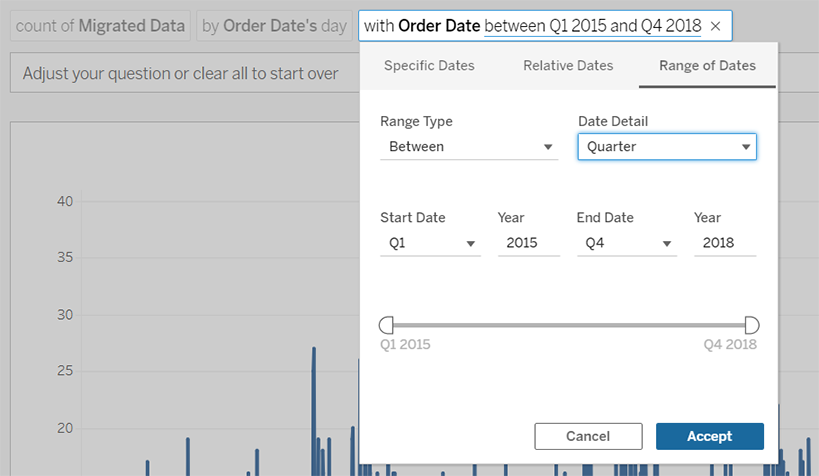
9 Adjust date ranges precisely with Ask Data
Now you can precisely adjust date ranges in the user interface. Choose an option: “Between”, “Starting”, or “Ending” in your questions, and change range type, date detail, and start and end points.
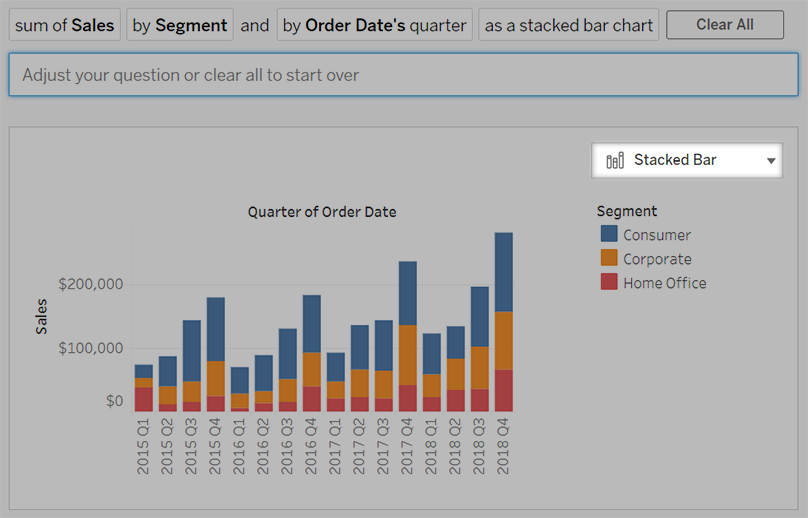
10 Automatic stacked bar charts with Ask Data
Ask Data now automatically displays stacked bar charts with data best visualized that way, since stacked bar charts are a great way to see how different categories contribute to your overall data. You can also display any query this way by adding "as a stacked bar chart" to your question or choosing Stacked Bar from the viz-type menu.
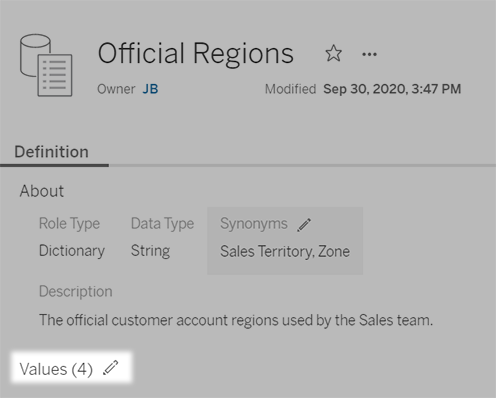
11 Edit synonyms for field values with Ask Data
Applying data roles to multiple data sources, you could previously edit synonyms only for field names, but now you can edit them for field values as well. Synonyms ensure that Ask Data returns relevant vizzes, even if users' terminology differs from field names and values in a data source.
Those are the most important new features in Tableau 2020.4, but there are still some smaller changes that should be taken into account as well, such as:
- Changes to image downloads in Tableau Server and Online, so selections made in the Page Setup dialog in Tableau Desktop (such as showing/hiding captions or legends) no longer apply.
- Use the new Custom Views tab to see your saved custom views as well as public custom views saved by others when you look at a workbook in Tableau Online or Tableau Server.
- Create collections to organize items for easy access to the workbooks, views, and metrics you need for your different work projects. You can also create public collections with onboarding resources for new employees on your team. Collections are available as a limited preview that your administrator can sign up for on Tableau Online only.
- Get notified when features won't animate in a browser. Find more information in Tableau’s website for unsupported browsers and features.
- Creators can author and edit workbooks connected to Salesforce data sources in Tableau Server and Tableau Online.
- Turn off Web Page objects in Tableau Desktop if you don't want Web Page objects in dashboards to display target URLs, for security or other reasons.
- Beginning with version 2020.4, Tableau requires you to have CPUs that support SSE4.2 and POPCNT instruction sets, which have been common for more than 10 years and are installed on most newer computers.
- Find more connectors built by Tableau partners in the Tableau Extension Gallery.
- Tableau Catalog updates*
- Data Quality Warning History admin view
- See quality warning details in Tableau Desktop
- Metrics appear in lineage and show data quality warnings
*Tableau Catalog is included in the separately licensed Data Management Add-on for Tableau Server and Tableau Online.
Did we miss any features you think are worth mentioning? Let us know in the comments below!
Click here to download the PDF version of this blog!
References
- Mapping Concepts in Tableau: https://help.tableau.com/current/pro/desktop/en-us/maps_build.htm
- Tableau 2020.4 Map Layers: https://youtu.be/uaAkvy1-XPA
- Tableau gives early Christmas presents with 2020.4: https://www.enterprisetimes.co.uk/2020/12/15/tableau-gives-early-christmas-presents-with-2020-4/
- Tableau 2020.4 Simplifies Data Preparation with Browser-Based Tableau Prep: https://www.theweek.in/wire-updates/business/2020/12/16/pwr4-tableau.html
- What's New in Tableau Desktop and Web Authoring: https://help.tableau.com/current/pro/desktop/en-us/whatsnew_desktop.htm