Without a doubt, the most controversial statistical topic is, by far, p-values. And still, it remains as one of the most misunderstood statistical terms, so much that even scientists struggle to give a decent explanation.
There is a reason for this: If you look for an easy-to-swallow definition for p-value, you’re probably going to be disappointed. The “for dummies” explanation doesn’t exist, and if you find one, it’s probably wrong.
Most people don't even know what the "p" on p-value stands for!
So, what is it then, that makes this term so confusing?
The thing is that the meaning of p-value is convoluted and unintuitive, and as a consequence, it has been misinterpreted and misused--intentionally or not-- to a worrying extent.
There is another reason for this confusion: p-values don’t provide the answers that people really want, but we’ll get back to this later.
What is p-value then?
This article published in Investopedia defines p-value as “the probability of obtaining results as extreme as the observed results of a statistical hypothesis test, assuming that the null hypothesis is correct.”

That definition, as correct as it is, doesn’t really work for anybody without at least some basic statistical knowledge. This is because p-values are intrinsically related to a common practice in statistics called Hypothesis Testing. Therefore, we’ll first need to understand some basics of Hypothesis Testing and how it works:
Hypothesis Testing
Hypothesis testing is a statistical test used to measure the plausibility of a hypothesis by using sample data gathered from a larger population or a data generating process (a survey, scientific tests, etc.). In other words, it is testing the validity of the observations made in a sample by figuring out the odds that your results have happened by chance.
This technique is widely used in business development. By testing different practices or products and their effect they might produce on your business, you can make more informed decisions moving forward. It can keep companies from waiting time and resources on weak initiatives and focus on what has the most potential to be effective. Although hypothesis testing, when done wrong, can have the opposite effect.
Null hypothesis
It reflects that there will be no observed effect in our experiment. In other words, it’s the default hypothesis, the thing that’s already established and it’s accepted in advance. It's what we attempt to find evidence against in our test.
Alternative hypothesis
Alternative Hypothesis (also called Experimental Hypothesis or Research Hypothesis): Reflects that there will be an observed effect in our experiment. It's what we are attempting to demonstrate in an indirect way. It involves the claim to be tested.
The Null Hypothesis and the Alternative Hypothesis are always mathematical opposites. In other words, the Alternative Hypothesis is whatever the Null Hypothesis is not.
Now we can get to what we’re here for:
P-value
The p-value is the likelihood of your observations assuming that the null hypothesis were true. It is a number that we use to measure the odds that your results have happened by chance, then ultimately determine the statistical significance of those results.
The p-value gauges how consistent the results are with the null hypothesis. One of the best examples is the flip of a coin. If you flip a coin once, the probability of it landing on tails is ½ (or 0.5). If you flip the coin twice, the probability of it landing on tails twice is ¼ (or 0.25). That probability is your p-value:
- A coin landing on tails once, p-value = 0.5,
- a coin landing on tails twice in a row, p-value = 0.25,
- a coin landing on tails three times in a row, p-value = 0.12,
- and so on.
In order to label your result as statistically significant, your test must obtain a p-value of 0.05 or lower.
The pass outcome of a Hypothesis test can either be:
-
- Reject the null hypothesis: If you find evidence against what is believed to be true, you promote the alternative hypothesis indirectly, given that the alternative and null hypothesis are mathematically opposite.
- Fail to reject the null hypothesis: If you fail to find evidence against what is believed to be true, it remains as the "accepted" truth.
If we go back to our example with the coin, the general assumption of your coin being normal (one side heads and one side tails) would be your null hypothesis.
That means that your alternative hypothesis would be that your coin isn’t normal, so it would be a “trick coin” with both sides being tails.
Your coin landing on tails more than 4 times in a row, gives you a p-value lower than 0.05, so you have statistically significant results pointing out that your coin might be a ‘trick coin’ given that the chances of a regular coin landing on tails 4 times in a row are very low.
A lower p-value indicates stronger evidence against the null hypothesis and a lower probability of a false positive.
With all that said, it becomes clear why p-value is so widely misinterpreted and the consequences that this might have, especially when making business decisions. And that’s why we decided to debunk the most common myths about p-value in order to help you clear any doubts you might still have:

This is the most common myth about p-value and its meaning.
It WOULD be nice if you could prove a claim by simply obtaining a p-value of 0.05 or lower in your experiment, and this is why many people believe this is the case. But p-values just don’t provide that answer. We use Hypothesis Testing to know the likelihood of our observation.
Hypothesis tests use data from one specific sample with no reference to the outside world. The observation of a single sample doesn’t represent the whole population, so there is no basis to draw that conclusion.
Do not think of a low p-value as being the deciding factor to prove your hypothesis. Otherwise, it’ll negatively affect your decision making, making you believe that your desired results are proved to be infallible when they’re not.
With all that said, MYTH #1 BUSTED.

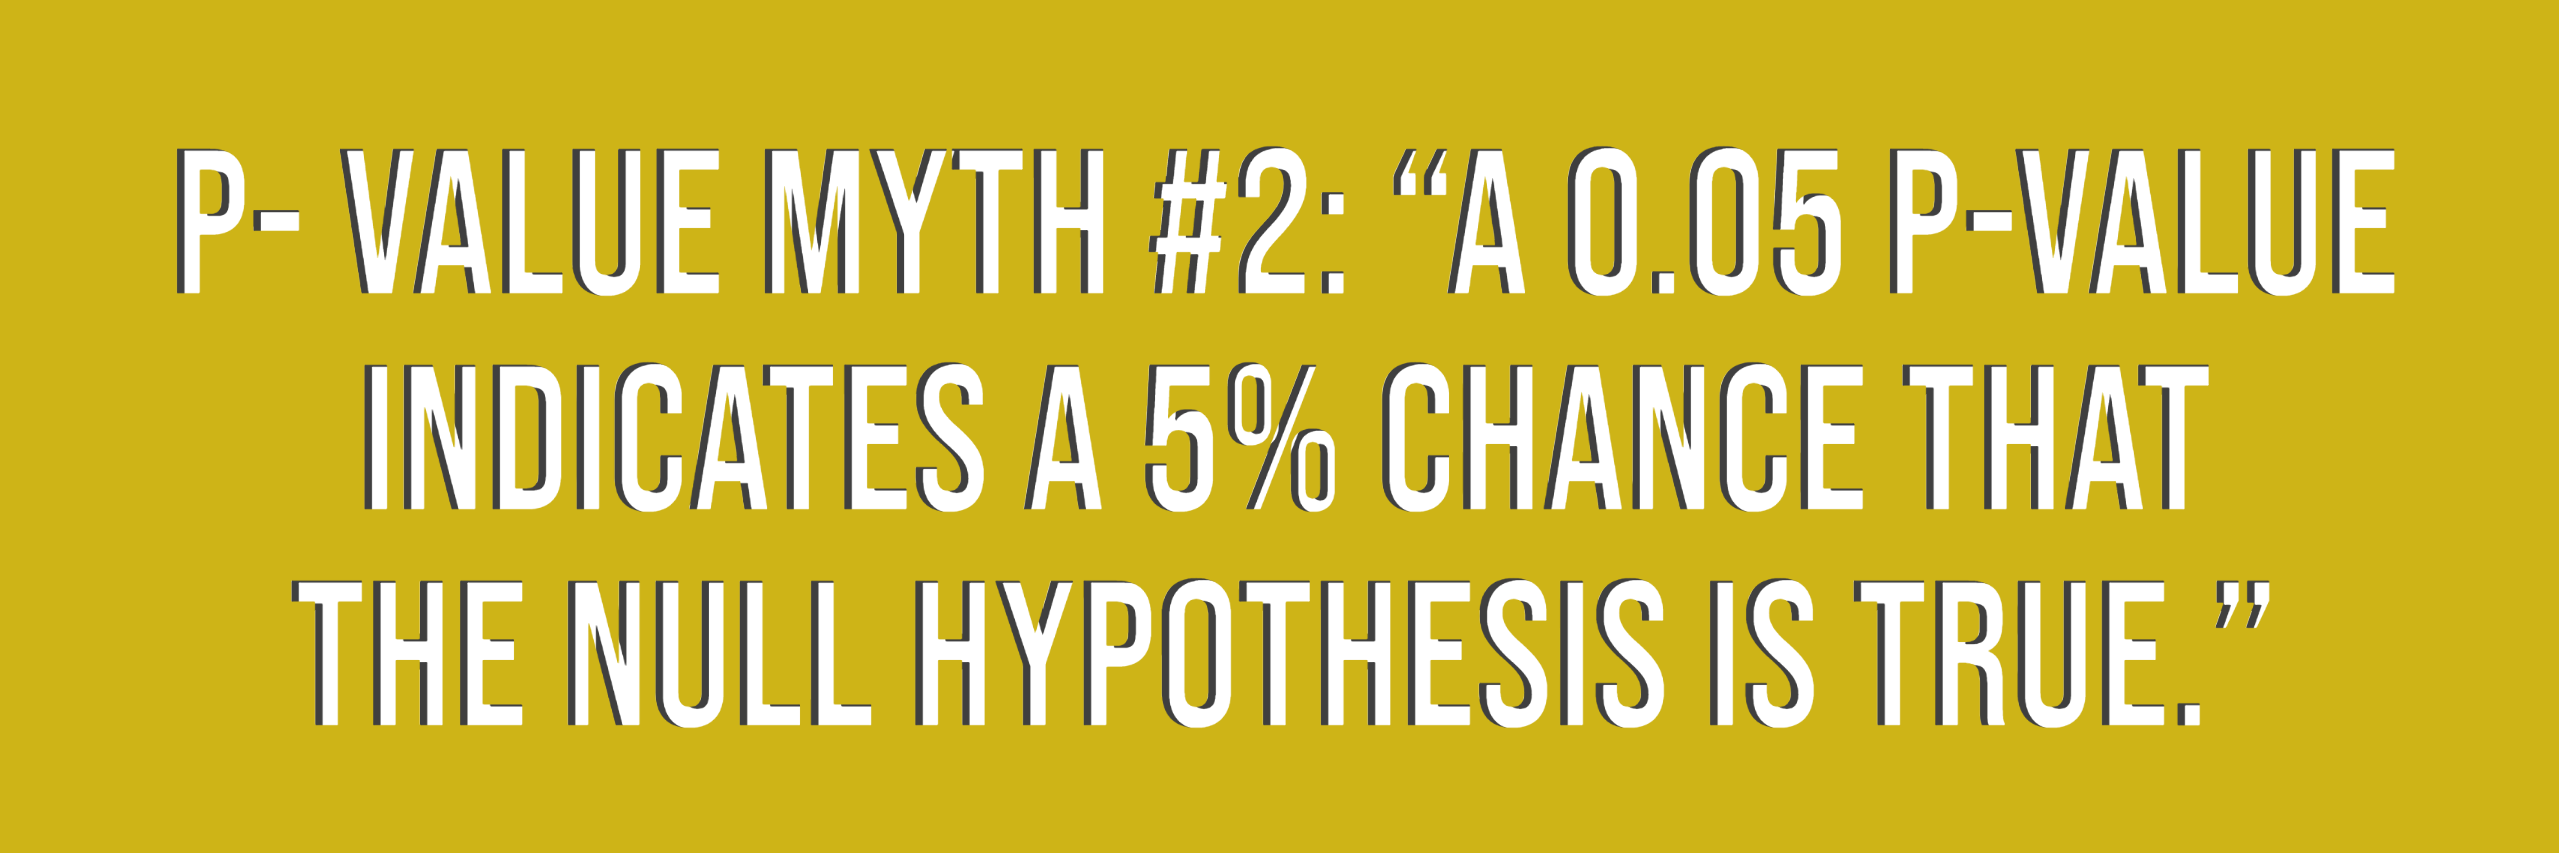
Our second myth is almost as common as the first one. Believing p-values represent the probability of a hypothesis being true for the whole population is nothing but a thinking trap that can lead to false positives.
We said before that a lower p-value indicates stronger evidence against the null hypothesis, but it doesn’t directly represent the false positive error rate.
Reproducibility is theoretically related to p-value, but this doesn’t translate to a 0.01 = 1%. In order to understand this relationship in real life, repeated experiments are the way to go.
A series of replicated experiments with statistically significant results (p-value 0.05 or lower) is what can ultimately provide confidence in the conclusions. That is exactly what this study published in Science Magazine did.
They replicated 100 psychology studies that had statistically significant findings. The researchers found that only 36 of the 100 replicated experiments were statistically significant. That’s a 36% reproducibility rate!
In short, we can’t extrapolate p-values with exact probabilities of our desired observations being true for the whole population.
Which means: MYTH #2 BUSTED.

This myth is simple to debunk with a little logic: Just because your observation shows high statistical significance (high probability that the hypothesis is true) doesn’t mean that the practical significance of the result (the magnitude of the effect) is significant.
Let’s use a pill that claims to help with hair regeneration as an example. The alternative hypothesis is that the pill works and the test subjects grow hair after they took it, and you manage to obtain a result that points to the pill working. Not only that, the p-value you obtained is really low, which means the chances of the pill working are very high.
The problem is that the pill might just help to grow a few hair strands, so even if the chances of the pill working are high, growing a few more hair strands is insignificant for the customer buying the pill. So, we can confidently say: MYTH #3 BUSTED.

Now that you know how to distinguish between p-value myths and facts, you can understand the huge consequences of these misconceptions.
Spread the word to help others be aware of the dangers of p-value fallacies!
Want the PDF version of this blog? Click here to download it.
References
- Frost, J. (2020). Why Are P Values Misinterpreted So Frequently? Retrieved from https://statisticsbyjim.com/hypothesis-testing/p-values-misinterpreted/
- Gurav, S. (June 1, 2020). Hypothesis Testing & p-Value. Retrieved from https://towardsdatascience.com/hypothesis-testing-p-value-13b55f4b32d9
- Quang, T. (March 21, 2016). Key to statistical result interpretation: P-value in plain English. Retrieved from https://www.students4bestevidence.net/blog/2016/03/21/p-value-in-plain-english-2/
- Science Magazine. (28 August, 2015). Estimating the reproducibility of psychological science. Retrieved from https://science.sciencemag.org/content/349/6251/aac4716
- Aschwanden, C. (November 24, 2015). Not Even Scientists Can Easily Explain P-values. Retrieved from https://fivethirtyeight.com/features/not-even-scientists-can-easily-explain-p-values/
- Beers, B. (February 19, 2020). P-Value Definition. Retrieved from https://www.investopedia.com/terms/p/p-value.asp

