The introduction of the Tableau Prep product changed the way traditional data preparation was made in Tableau with a more visual and direct way to shape and clean data. Still, different kinds of data have different preparation methods, and one of the most challenging ones is survey data.
The problem with survey data is that they come in spreadsheets where each question is its own column; there are different types responses, and there’s usually extra columns with demographic data to deal with as well. This makes it fairly complex to prep the data for analysis, since you have a mix of different types of data all thrown in together.
That’s why we at Empirical decided to make this step-by-step guide to help those struggling to have their survey data prepared in Tableau Prep. But before you go ahead load your data to Tableau, you have to make sure it is in the right format.
How to format your survey data for Tableau Prep
Survey data usually contains 4 elements:
- Demographic information: Gender, location, weight, etc.
- Survey responses in text format: Yes / No questions, free text questions, etc.*
- Survey responses in numeric format: Questions about salary, Likert scale, etc.
- Meta data describing survey data: Question ID, Response ID, question type, etc. These are a huge time saver once we upload the data into Tableau.
*Likert scale questions are usually considered numeric since the universe of possible values usually range 1-5, 1-10, etc. But this only works if the questions being asked all have the same answers (i.e. 5 means “Strongly agree” in every question). If in your Likert scale questions 5 sometimes means “Strongly agree”, but for other questions it means “Critical”, you need to have both numeric and text results for your Likert scale questions depending on the case.
This is a good example of the shape and order your survey data should have:
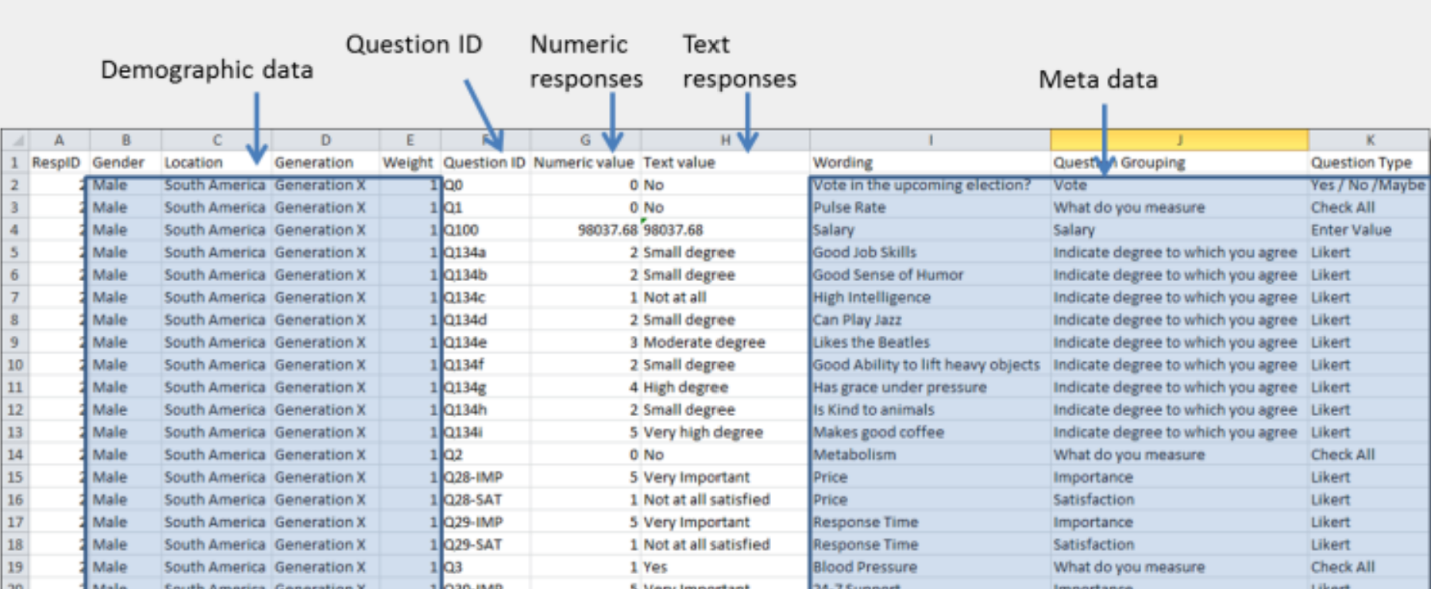
Example survey data in the best format for Tableau. Source: Data Revelations.
Once your data is in good shape, you can proceed to load it into Tableau Prep and follow our 7-step process:
1 Create a Branch for you demographic and filtrable data
The first thing to do after you load your data into Tableau Prep is to separate demographic data from the actual survey responses. You also want to add any filtrable fields you might have.
Filtrable fields is the data that you might use to filter your respondents, and sometimes these are questions. For example, a question that says “Would you ever purchase from us again?”, and you want to be able to filter on whether your respondents answered “no” to investigate and find more details about these cases.
Select all columns with respondent demographic info and “filtrable fields” and create one branch with them.
2 Create Branches for each Question Type
Before we go ahead with this step, you need to know what type of questions you have in the survey, (i.e. yes/no, numeric characters, free text, etc.). If all the questions in the survey are the same type, (e.g. they are all yes/no questions), then you’re in luck!
Simply load in your data, shift-select all columns with questions and do a simple pivot with all of them. You’ll get a question field and a response field which you can then use for analysis.
The problem is that most survey data does not contain just one type of question, in which case, pivoting all the question columns will end up with free form text, yes/no, and numeric values all put together in the same response field. Tableau will read it all as string, but then you cannot use this data to analyze or make any visuals with it.
This is the most common problem people face when analyzing survey data in Tableau, but there’s a solution to that.
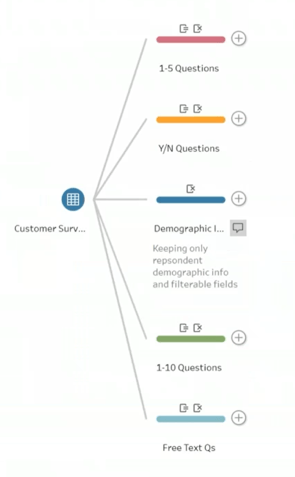
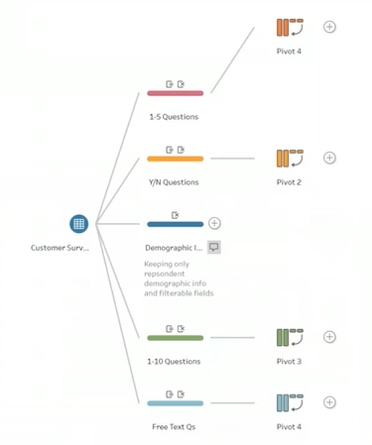
What you need to do in this case is to create one branch for each of your question types, just like you did with the demographic data. You can label each branch as “Free form text”, “Y/N”, “Numeric”, “1-5”, and “1-10”, for example.
Look at this example where you’ll find a branch for each type of question as well as a separate one for the demographic data:
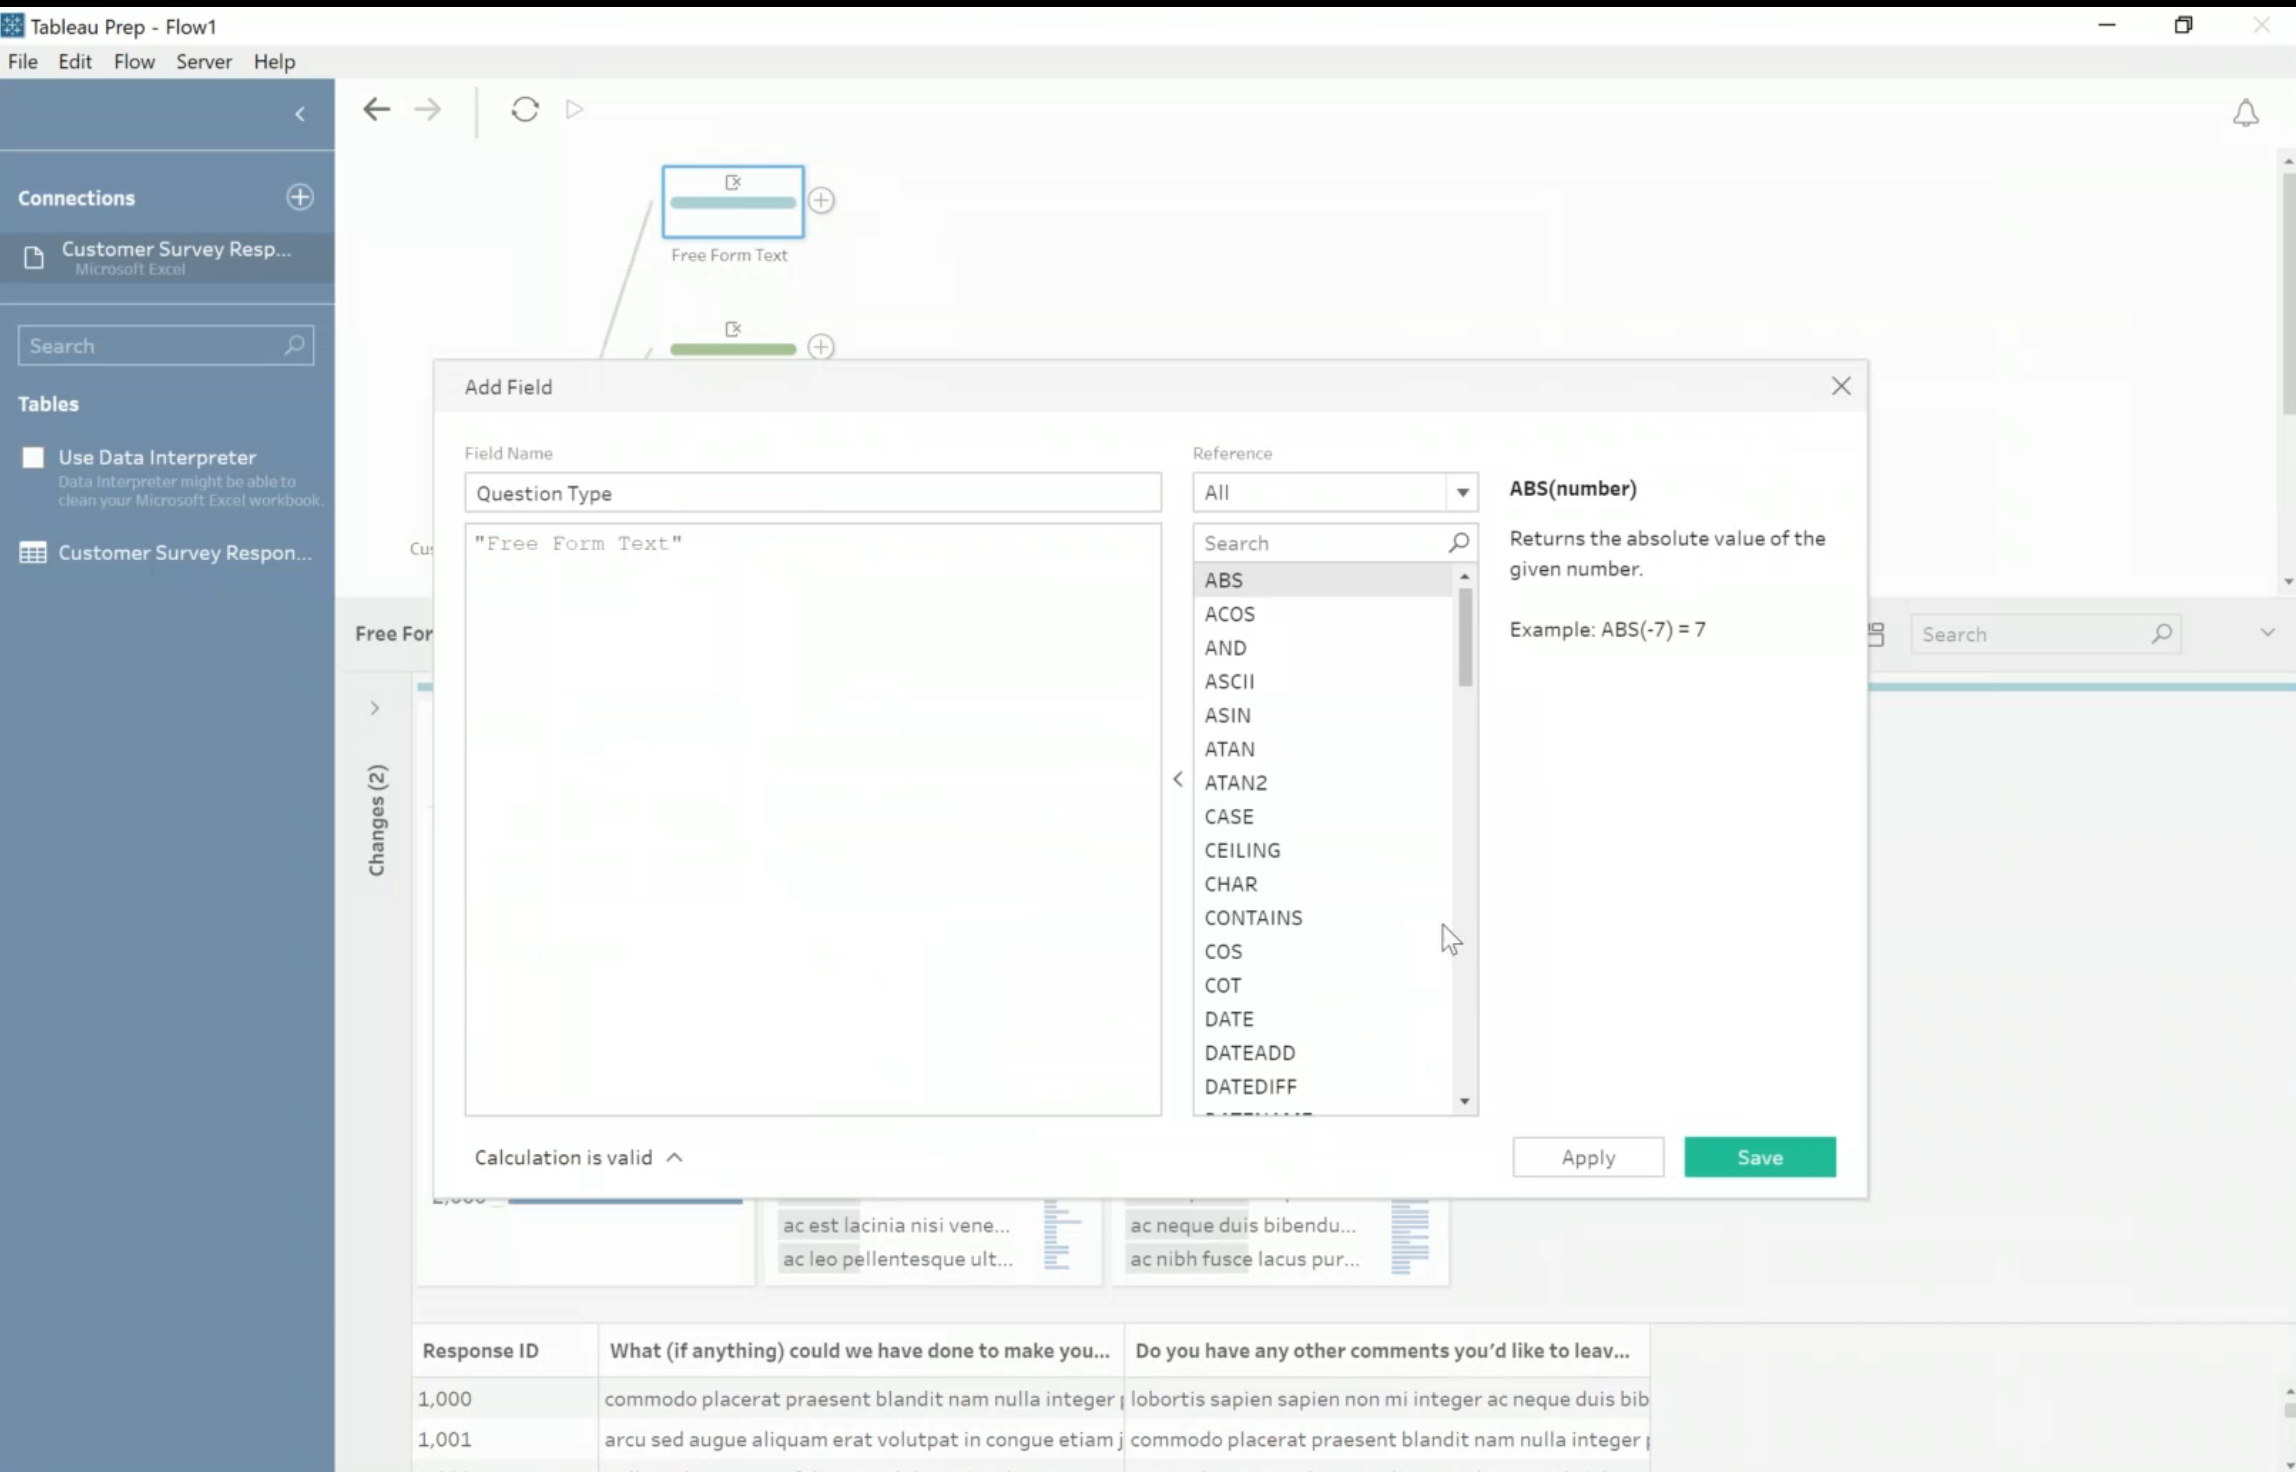
3 Create a “Question Type” field for each branch
After you created all those branches, proceed to create a “Question Type” field for each of them. To do so, select one of your Question Type branches, click on Create calculated field and type in the field name (we recommend using the same name you used for the branch). Then repeat the process for each Question Type branch. This helps when moving the data to Tableau Desktop, and allows you to filter your data by question type.
4 Pivot your Question Type branches
Select one of your branches and add a pivot, then drag and drop all your questions fields into Pivoted Fields to create the pivots. The “Question Type” field you just created or any “Response ID” or “Question ID” field you might have can remain independent from the pivot.
You will see 2 new fields that the pivot created named “Pivot1 Names” and “Pivot1 Values”. These will be your Question and Response fields respectively, so you need to rename them:
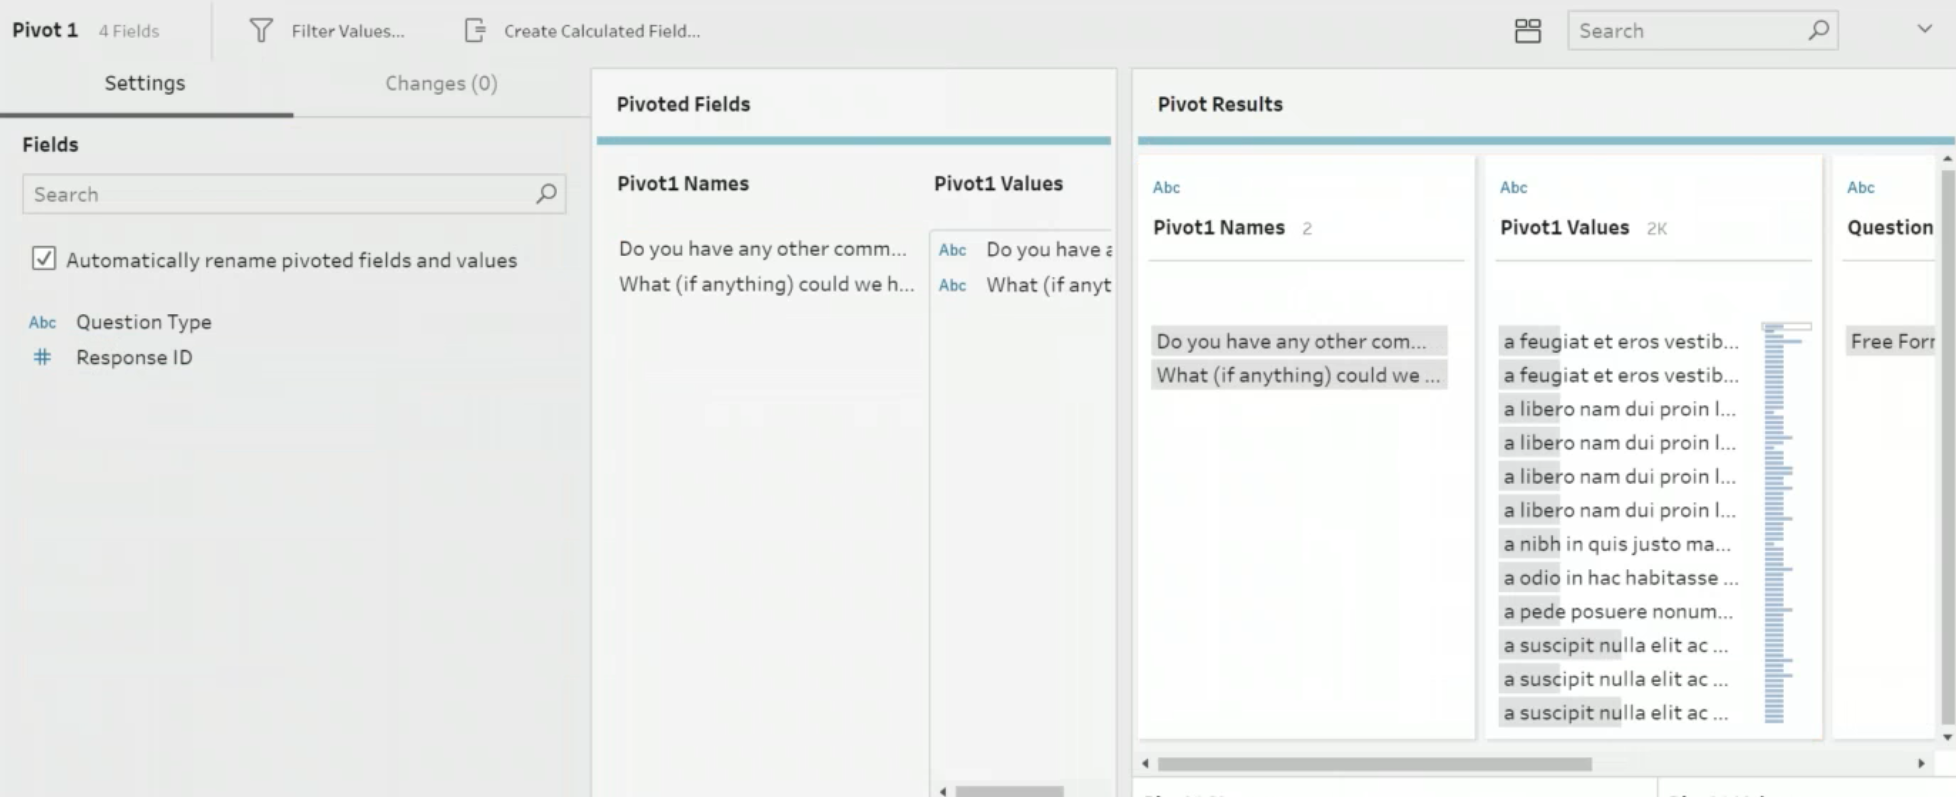
- Click on “Pivot1 Name” and type “Question”. This will be your “Question”
- Then select “Pivot1 Value” and type “Response (text)” or “Response (numeric)” depending on the type of response your branch has. For example, if a Question Type branch is for Free Text questions, name it “Response (text)”.
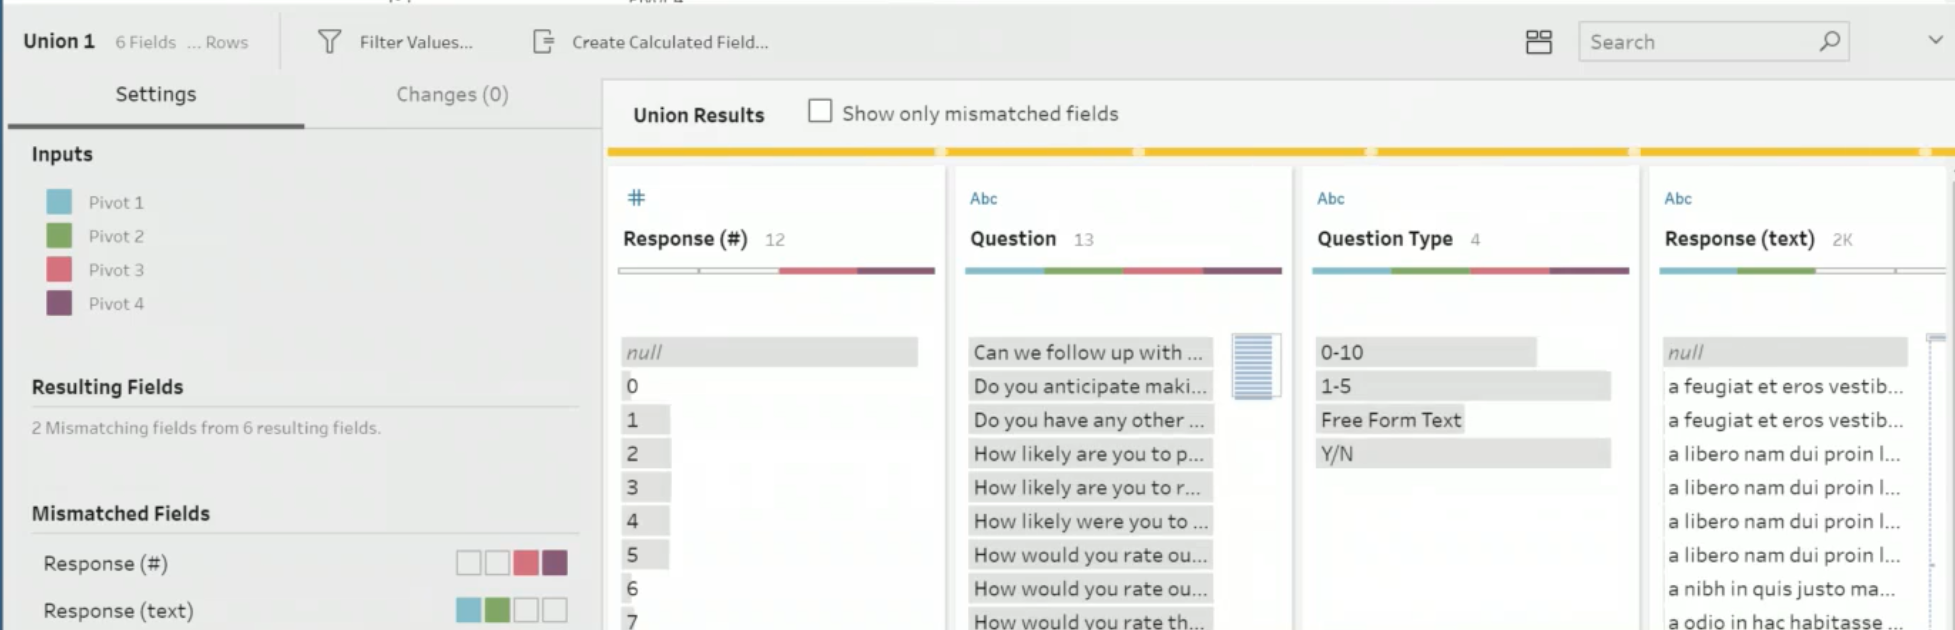
5 Union the pivoted Question Type branches
Drag one pivot and hover over another and select Union to create a Union, then do the same with the rest of your pivots to Union them all.
After you have your Union, you will see one “Question” field and two “Response” fields (text and numeric) with colored bands representing their corresponding pivots depending on whether they are numeric or text:
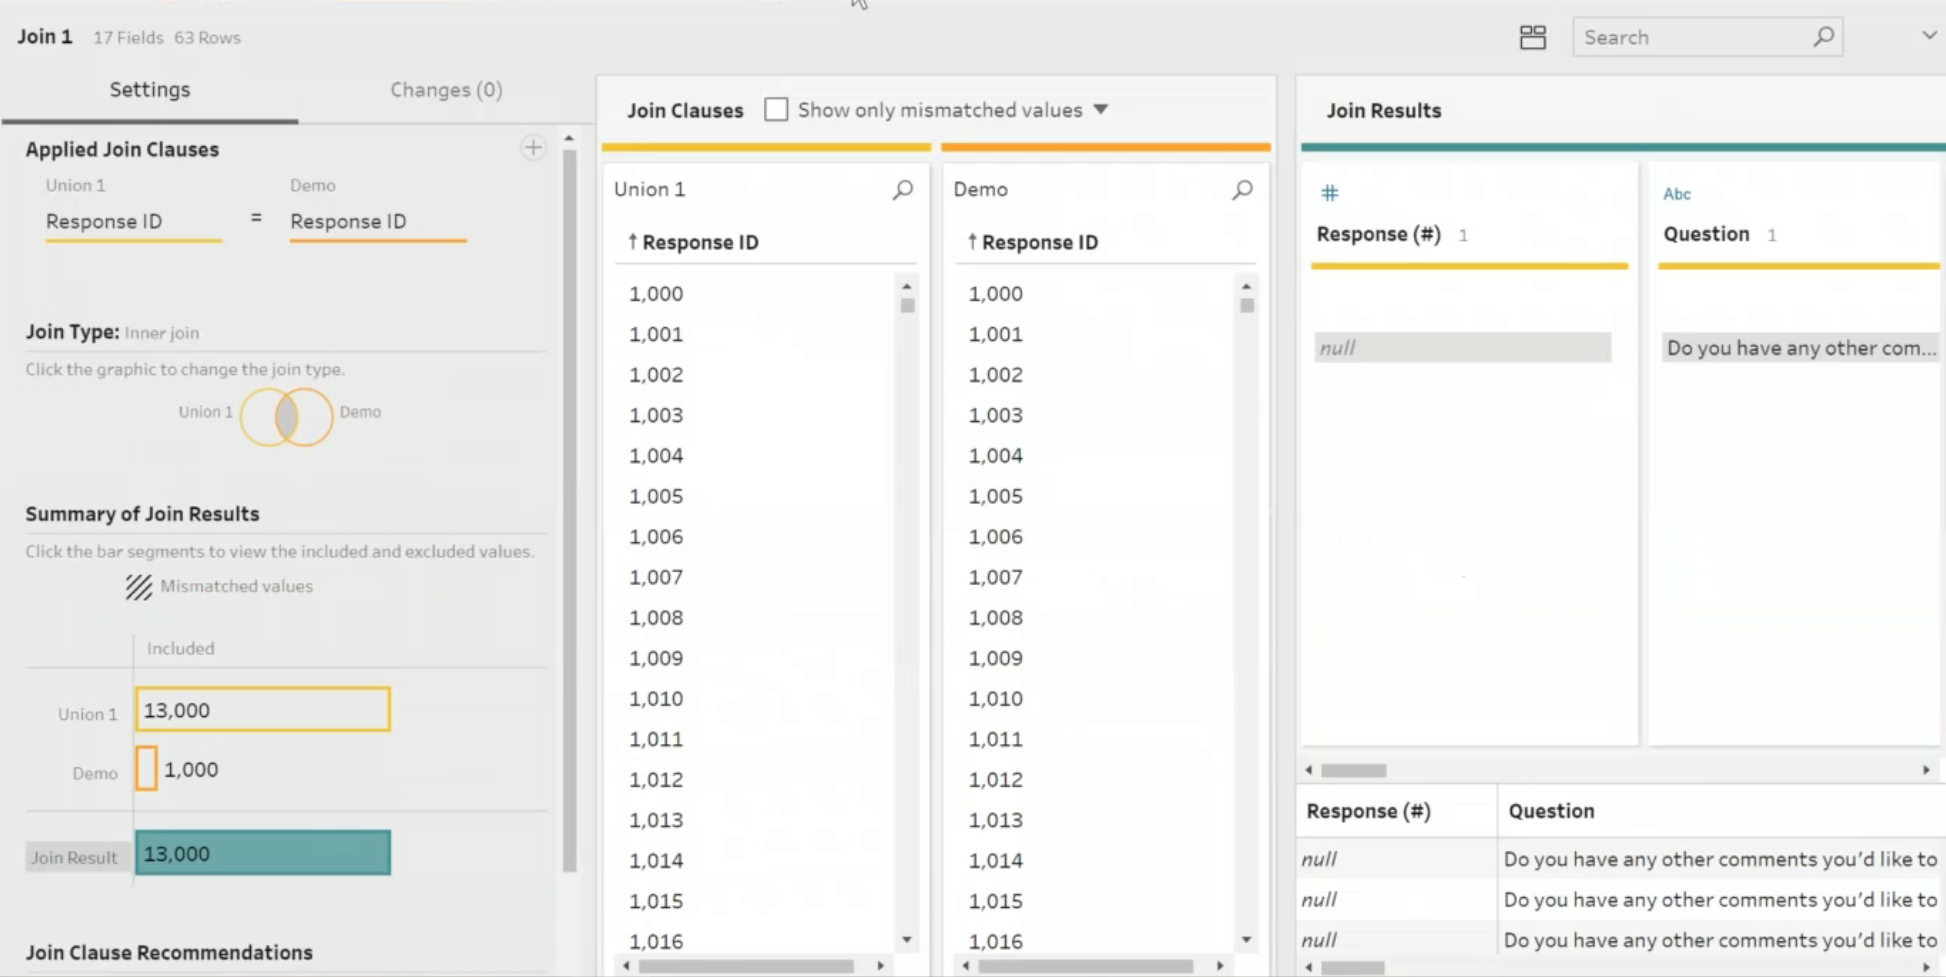
6 Join the Question Type Branches with the Demographic Branch
Drag the Demographic Branch and hover over the Union you just created and select Join. Tableau will automatically match them using the “Response ID” field in your data.

Make sure that all your rows of data from both sections are included. If not, check all of previous steps in case you missed some of the Response IDs.
7 Clean the data and Output
Now it’s time to clean your data. Add a step to take a quick look and check for any problems. Here are 3 tips so you can more easily do so:
- Tableau adds “-1” when it finds two fields with the same name. So, if “Response ID” has a duplicate, you will find it as “Response ID-1”. Type “1” in the search field to find duplicates. Remove any duplicate fields, if any.
- Use the Group by Pronunciation feature in Tableau Prep to correct spelling mistakes in your free text responses and group answers with slightly different formats, such as mixed cases or trailing spaces.
- Check if there is a field called “Table Names”. This is a field that Tableau generates by default when you Union all the different sections together. Since we already separated our question types, the “Table Names” field is redundant (and less useful than what you have created) so you can remove this one as well.
After your data is clean, you can proceed to output the data. We recommend the “.hyper” file type allows you to dive straight into visualizing your data in Tableau, but it’s up to you to decide which one suits you better.
We hope this guide was helpful to you. Feel free to ask any questions in the comments or book a time with one of our specialists if you need more assistance. We are always happy to help!
Click here to download the PDF version of this blog!
References
- Ganeshalingam, A. (June 20, 2018). Quick tips for preparing survey data in Tableau Prep. Retrieved from https://www.tableau.com/about/blog/2018/4/quick-tips-preparing-survey-data-tableau-prep-85432
- Wexler, S. (October 13, 2015). Getting Survey Data “Just So”. Retrieved from https://www.datarevelations.com/resources/surveyjustso/
- Wexler, S. (May 3, 2018). Getting your survey data “just so” using Tableau Prep. Retrieved from https://www.datarevelations.com/resources/tableau-prep/
- Parker, E. (January 25, 2019). Preparing Survey Data with Tableau Prep Webinar Video. Retrieved from https://onenumber.biz/blog-1/2019/1/25/preparing-survey-data-with-tableau-prep